Almost all of the Inflationary pressure is from Price Gouging. Price Gouging to take advantage of coming out of Covid and we pay for 2 years of losses even though they were subsidised by the taxpayer during Covid. There are some supply chain issues as the Business model of just in time crashed. The War in Ukraine highlighting the short term policies of Governments (No National Interest) and Corporations who could have started the transition to renewables and EV’s a Decade ago,eg: All vehicles should have been Hybrid by Now if not EV’s. Companies across Europe are now buying EV’s for Deliveries and finding a 70% reduction in running costs. And Price gouging to create higher Inflation so Interest rates go up and Finance can get quick margins profits. Remember in Australia that Interest Rates went down 3 times for a total of .75% and it wasn’t passed on. And as we see all Interest rate rises will be passed on so Greed rules Again. Privatised Profits, Socialised Debts.
Floods have an effect on growing fresh produce and this results in higher prices. Employment levels are very high compared to the last few decades, this effects wages and so the price of goods. Fuel prices are up for several reasons. Rents and property prices are all up due to a shortage of vacancies and short sighted programs that pump money into the market instead of out of it; is is a long term problem but having its effect now nonetheless.
How do you know this? Who is doing it?
I don’t recall, when was that, did none of the lenders pass it on or did they catch up eventually one by one?
This isn’t the case. There are many factors which can affect inflation. An example being what has caused the current spike in fuel prices. This ABC article summaries why fuel prices have increased:
Likewise with many other commodities. When the cost of inputs to their production (energy, raw materials, labour etc) increase, these can flow through to increased prices consumer’s pay at the checkout. With slight increases, in the past some businesses have absorbed such increases especially where higher prices in one item is offset by a lower price in another. Currently due to a range of factors (not relating to price gouging), inflation has increased across the board and most business are unable to absorb these increases, and as a result are passed onto the consumer.
An example for foods is potatoes, but applies to most other farmed products. The ABC has also outlined why potato chip prices may also be on the increase in the near future:
If inflation was due to price gouging, then it could be easily fixed by governments - taking action against the price gougers to keep inflation under check. This unfortunately isn’t possible.
Regarding price gouging, one could come to that conclusion by observing corporate profits for those corporations that have been significantly raising prices. A reasonable conclusion is if supply and operational pressures were the cause of price rises their profitability would not have gone up as it has. Such is the free market system. What constitutes ‘gouging’ is another topic.
On corporate profits and how they are used.
They could go towards reducing corporate debt, improving the business/products, expanding the business, or initiatives to reduce costs. The last might offer hope that prices in a competitive environment reflect true cost. There are a great many costs built into the final price of many products. Some are built into the price, others come as an add on extra.
More than just Afterpay referenced in the article.
Floods temporary, Employment Levels with almost no Wage Growth very low pressure. Fuel up again temporary and if we spent the last 26 years (Toyota Prius 1996) making all vehicles Hybrid the demand would be half and pollution levels from vehicles as well.
So you are saying the Financial Market that has been Socialising it’s Debt and living off Zero Interest rates since 2008 and got a tax payer reprieve because of the Pandemic didn’t realise this Cash Cow was running out so they needed a new guaranteed source of Income Higher Interest and Higher Prices. ACCC has no laws to stop Price Gouging so the Elephant in the Room is never spoken about only the FEAR of Higher Wages.
I have a Mortgage and I watched my Interest rate drop and I noted 3 times none of the Banks passed on a .25% cut.
Record profits for Big Corporations so running costs not causing Inflation. In the USA they have plenty of Oil to supply their market Price Gouging still happened. The dependency on Fossil Fuels and no action for 20+ years plus spending Trillions (USA,UK,Australia) on War in Iraq to keep the Oil flowing gave a false economy. We used to have a Prices Surveillance Authority but when Lib/Lab decided to privatise Essentials they didn’t want Greed suppressed. Eg: The Electricity Market. Now Price Gouging as they didn’t invest in Renewables and Modern Infrastructure…Don’t worry the Taxpayer will foot the Debt/Bill and the Private companies will still gouge.
I am saying nothing of the kind, that idea came out of your mind. What I did was ask you to provide some detail so we could better understand your problem.
You are throwing several gripes into the pot together and stirring well - which we all tend to do at times. The problem is without any specifics of who, what, when and where it is all going to remain generalisations that are too hard to come to grips with and too vague to talk about causes or possible cures.
I am sorry it’s too hard for you to come to grips with. The Who? Do you think one person is responsible for Finance?. Finance/Corporations,Banks and corrupted Governments/Media etc work in almost lock step with each other. Observe the 2008 Global Fraud Crisis. Ratings Agencies dominated/Dictated what Governments were good for the Financial Market and were respected as the Standard. Alas their AAA rating of the Junk Loans which included Housing shot their credibility down. Prior to that the Media would use it to bring Governments into line if they spent money on Social reforms "Spending on Welfare will affect our AAA credit rating …Scary don’t do it! But when the Crash happened the “Free Market” went begging to the Taxpayer (their bought Politicians) please bail us out give us low Interest rates and don’t lay too many charges against us. We will spend the profits on record bonuses and wage rises for the 1% and buy back our stock to boost our Shares. You…the Government will pay for the Unemployed and people kicked out of Homes (We will buy those now cheap homes with money you gave us). Keep giving us Zero Interest rates as a reward and that way the gap between rich and poor will widen. Make sure You gut/harass Unions, keep wages down and don’t talk about our price hikes or even discus it as a solution to stop rising inflation. Make sure Climate Change action is suppressed so we will spend little on updating the Grid or Renewable Energy so when it becomes a problem we will raise prices on the more expensive and dependent Fossil Fuels and again the Taxpayer will come to the rescue spending money on the Infrastructure while we keep the profits. And make sure you help our Fossil Fuel Polluters keep in Business as long as possible as 30+ years really isn’t enough to adapt to change.
I made the mistake of reading just the chorus:
Yeah, things are crook in Tallarook
And I’ve heard Cooma can be drear
Things may be blue in Bookaloo
But they couldn’t be as bad as being here.
I think I get it now, this verse has the specifics:
The overdraft is through the roof, so’s the flamin’ rain
All my dreams go up in smoke and hope goes down the drain
The fences have all fallen down and the stock’s just wandered out
And they tell me when this flood subsides there’s gonna be another drought.
A timely article that supports the OPs contention, although ‘the word’ might be different.
Very different. If this suggested reason were correct, why is every nation (both developed and developing) all facing the same cost of living pressures.
On average company profits have been drifting higher for good part of a decade. Inflationary pressures accelerated in February 2022. A significant timing mismatch.
If the hypothesis that businesses zest for profits has caused the current inflation spike, one can expect the current corporate reporting season to have spectacular jumps in profits, far greater than the underlying inflation rate (if say inflation is 5%, this in theory would increase company revenue by about 5%. If input costs are static, profits will increase substantially more than 5% and would be around that of the increase in total revenue). I am hot holding my breath, and look forward to being proven wrong.
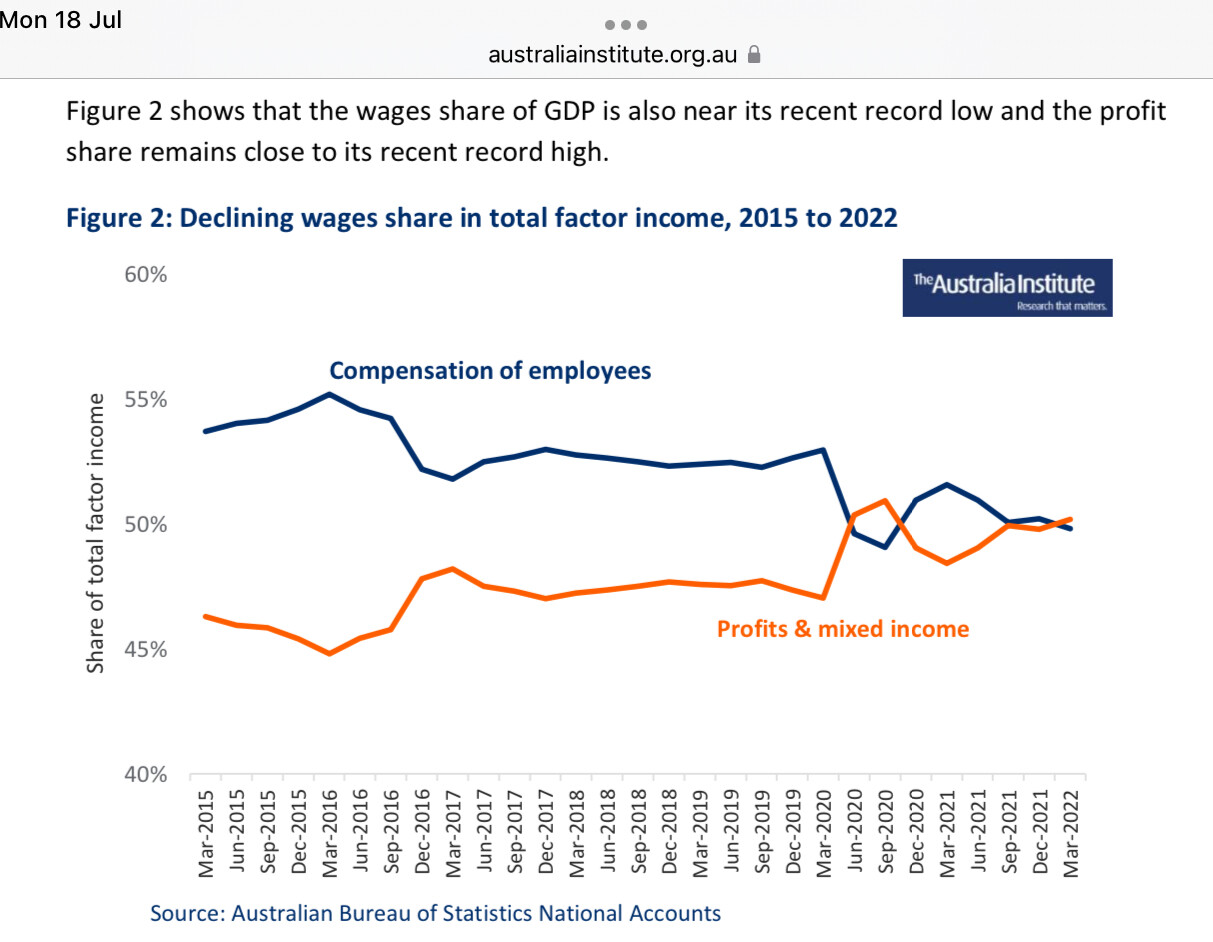
It’s worth referring to the source analysis by the Australia Institute. It relates national ABS data, and Europe. For Australia, labour costs up to the March 2022 qtr have progressively reduced as a percentage of total factor income. Profits have continued to increase with a clear step change at the start of the Covid pandemic.
The Guardian has offered a shortened explanation.
Holding one’s breath is supposedly a valued practice for free divers and snorkeling. The benefits if any to economic and accounting analysis, uncertain. Best left to the experts in either field. ![]()
The ABC’s ‘The Drum’ Mon 18th July devoted some time to discussing key concerns. For those with some time to spare.
It could be capitalism at work and that the actions of a company in one country affect their operations in another. I doubt the report is a conspiracy but there could be and seem to be differences in one’s outlook and how evidence is perceived, be it rightly or wrongly or in between.
I’ll just add a graph of Australian corporate profits for the past ‘max’ years and the recent change in the curve suggests near exponential growth rather than a linear function over time.
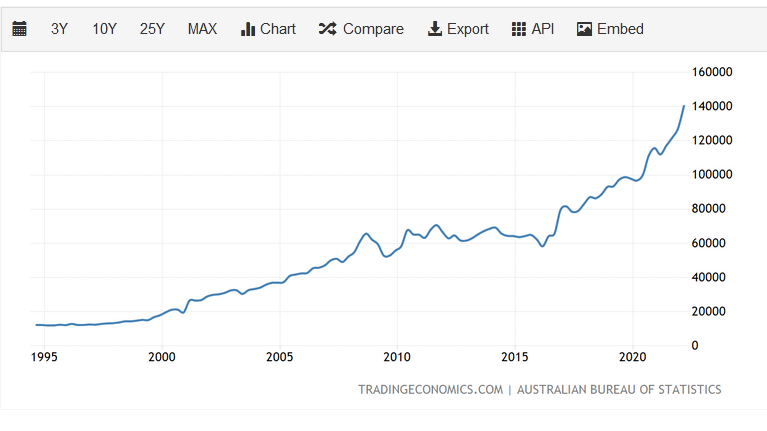
It is linear…
The uptick (above trend) in 2020/21 could be due to government cash splashing such as jobkeeper and other temporary social security allowances. Increasing government debt has strengthened company bottom lines, which isn’t surprising.
It still doesn’t explain why inflation acceleration over the past 6 months is due to a couple of decades of steady corporate profit growth. Blaming corporate profits for inflation ignores the significant change in geopolitics in the world in the past 6 months.
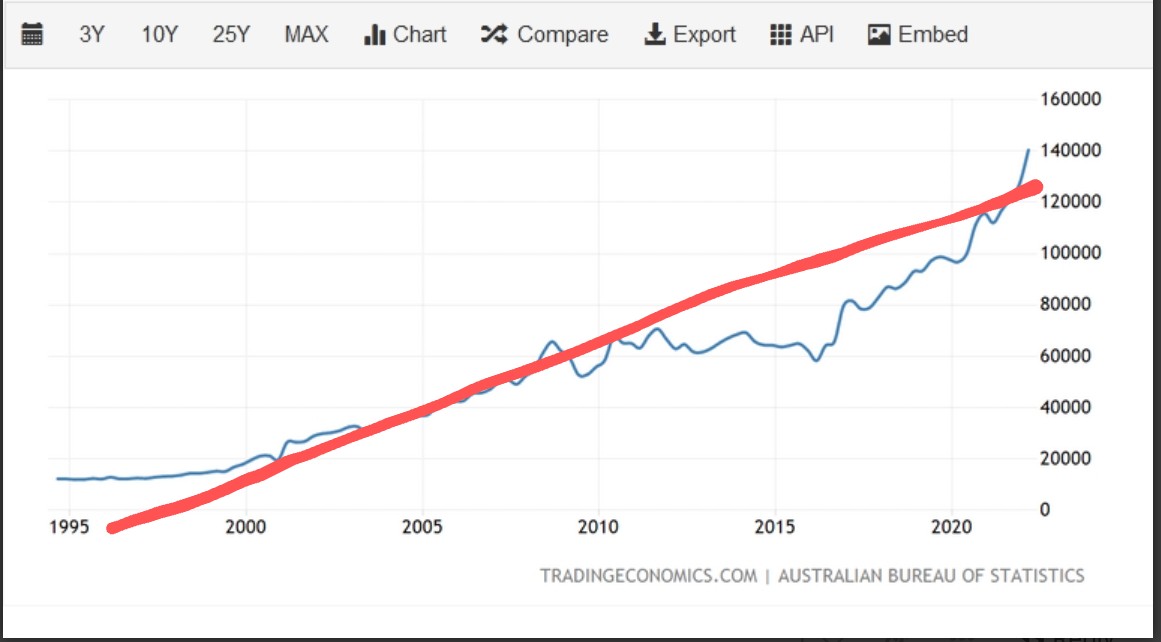
In general you cannot determine that just by looking at the scatter of points on a graph. Taking the view that a graph like this is a combination of an underlying trend and short term noise is common. If you do that you can try fitting various curves (including a straight line) to the trend and see which fits best. That doesn’t necessarily tell you much about the reasons for the behaviour but in econometrics any kind of fit is a win ![]()
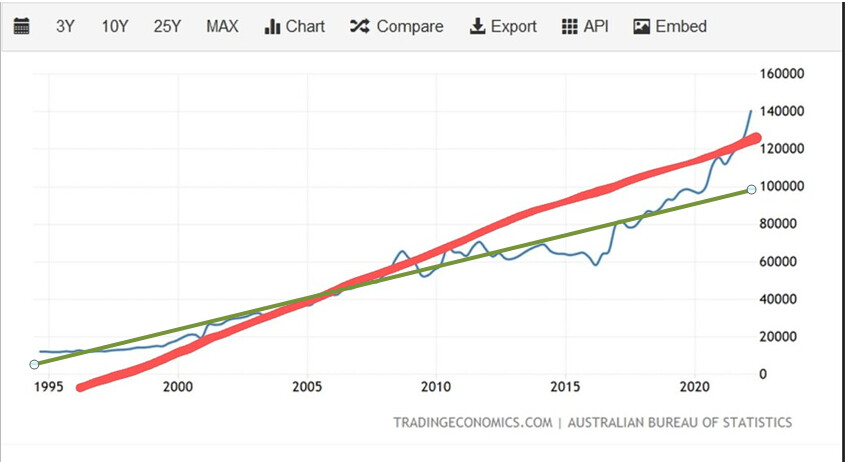
I like the green fit better but
yet regardless I still prefer the green fit.
Some of us almost predictably line up with one view or another, ![]()
It is linear looking at long term profit growth which is what exists in the graph that was presented (it could he red or green line - possibly somewhere in between). If one only looks at the last couple of years, one could be mistaken profit growth has been exponential.
As outlined above, the rapid acceleration over the past couple of years can be easily explained and is possibly an anomaly. If the current reporting season shows further acceleration of profit growth (higher percentage profit growth than for the past couple of years), then it may not be an anomaly.
It is also noting that the chart is also potentially misleading as it only reflects publicly listed companies. If all small, medium and large businesses were included on the chart, it is likely the chart may show a different relationship.
Profit growth can also be affected by a large range of factors, inflation is one but not necessarily the driving factor. Inflation has an effect if companies work on fixed percentage margins. If their revenue increases due to inflation (what they sell becomes more expensive due to higher input costs), then with fixed percentage margin causes a corresponding increase in profits.
Those with higher borrowings inflation can be a curse as well as a angel. Higher inflation means higher interest repayments, but the value of the borrowings declines in real value over time. This also benefits government borrowings as $10 today might be only worth $5 in real value in 10 years time, making repayment on debt comparatively easier.
Selecting the period you prefer to consider and saying that the selection represents the underlying reality is a game often played. You see it a lot in climate change arguments. The dreaded “hockey stick” is one and leaving in or taking out the medieval warm period is another, using one hemisphere of data to represent the earth is a third.
For my sins I had to analyse the development application for an extractive industry project on a flood plain. They displayed a graph of rainfall for a selected historical period. I knew the source of their data and did my own graph. The plots matched but theirs magically cut off the early years of records for no given reason. About 4 years before their cut-off was one of the biggest floods on record. When you have only decades instead of centuries of data such decisions matter, especially if the reader is armed only with their eyes and not a battery of statistical tests.
I didn’t select the period or initially present the graph in question. The comment being made was on the graph which was presented. I also agree that selective presentation of data can be misleading and be used to portray a particular agenda. Economists have been doing such for years and try and present data which matches their own expert opinions. It is always important to look into reliable sources of data across a broad range of sources rather than what other may belief. The internet is already full of beliefs and selective data reporting to substantiate these beliefs.
However, while I didn’t select the graph, the range of dates presented (1995 onwards) could be considered reasonable as they are representative of the modern global economy which Australia and many other nations have embraced. The RBA and ABS use similar periods in presenting data as well.
Since mid 1990s may be more relevant to determine trends as evidence by:
3 year growth which looks like an exponential trend:
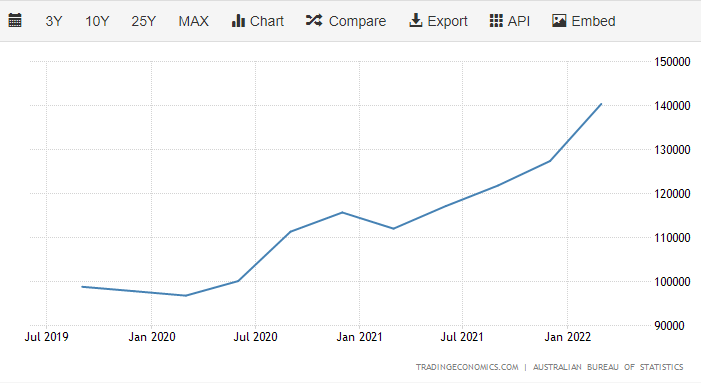
10 year which is also linear, but slightly higher growth rate than for 25 year trend shown above:
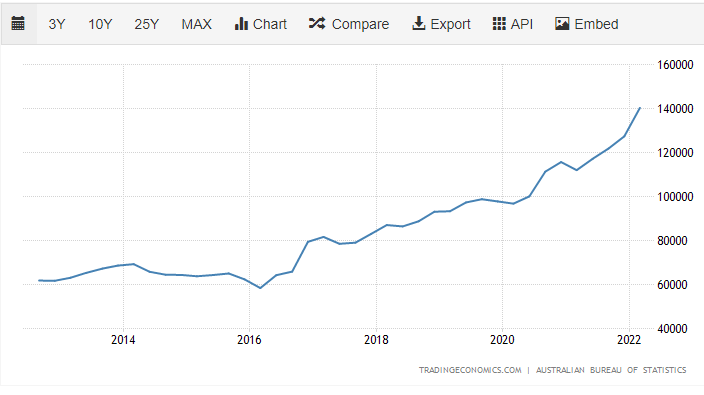
10 year could be also potentially used, but it could be argued as also being misleading as it doesn’t recognise the stagnation (lower than trend) of corporate profits for the period from 2008 - 2015/16 (post GFC environment). If one doesn’t believe the impacts of the GFC, then this period could be ignored. I am not sure there are many economists which would think this was the case.
I did. Re the data points, a difference in the best fit curve thrown (not computed) over the graph depends whether one takes the recent 2 years as illegitimate (gouging/profiteering profits) data - an aberration, or as a logical/reasonable evolution of long term profits.
I chose to focus on long term trends and view recent excursions as an abnormality. As I indicated with my post of the graph,
While not germane, I have a university minor in economics although well dated. Thus my viewpoint is somewhat educated including manipulation as seen from one view, or as making/demonstrating a point from another.
Let each reader view the graph and assess which curve (or which other curve) they see fit. The point was only that the graph appears to support the premise of