Most Gamers who live in Sydney or Melbourne or …!
My resident expert suggests it does not matter because anyone who is any good has already left the country to live somewhere there is better internet.
Trying to compete against the very best in SE Asia or USA or Europe from Australia, the ACCC has an answer?
Games hosted on servers located in Asia and North America recorded latencies exceeding 100 milliseconds. Some games may not require low latency to ensure a quality experience.
With the added burden of NBN Fixed Wireless one does not need to live as far away from Sydney as WA to see 50ms or greater latency when connected.
I see that the national average upload speed in busy hours is 85.0%. The only state/territory that actually meets or exceeds this is NSW, so the national average is a bit loaded.
In technology terms, FTTN remains garbage, with its only competitor at the bottom of the charts being Fixed Wireless. (Satellite does not make the charts, sorry people.)
Upload and download speeds have both dropped on average since the last reporting period. (There is no /golfclap emoji for me to use.)
If you want to go with the RSP that consistently beats performance expectations, that would be Exetel, although Launtel comes close. I think the most important question for this metric is how many of their customers are on FTTN or Fixed Wireless. On service quality, Launtel is better than the rest when it comes to outages of greater than 10 minutes.
The online gaming list (page 29 of the main report) does not include my current addiction but leans heavily towards Activision Blizzard with (off the top of my head) six of sixteen tested games. Definitely don’t plan for a great online action gaming experience if you use Fixed Wireless. While the report doesn’t say it, if you’re on satellite then online gaming is just a bad idea unless you’re playing chess or perhaps if you are using StarLink - and even with its low orbit satellites there are problems.
And if you are playing online games, live in NSW or the ACT. Apologies to those in the west, but I don’t know how you cope with those numbers.
Overall the message is it’s near perfect. With a few minor exceptions?
Not sure whether to laugh is appropriate. Even the NBN Fixed Wireless reports for downloads an 84.7% average speed for the busy hours.
It’s a great question.
My take is it’s splitting hairs to say one RSP is any better than another. In nearly all metrics the confidence intervals of the results for each RSP are broad enough to overlap the results of others. It’s also impossible to attribute the causes of any variation in results to the RSP or the NBN.
Whether the public ACCC reporting serves the best interests of consumers or avoids difficult questions of the NBN?
Two observations open to further discussion:
Performance is technology dependent - FTTN results report 13% (1 in 8) services reported as under performing. Fixed Wireless remains a poor outcome. The small number of white boxes (85) compared to the number of access towers provides a very limited assessment.
The statistical analysis does not account for or qualify differences in the subsets of the data aggregated when presenting the results. The statistical results are skewed towards presenting a more favourable outcome.
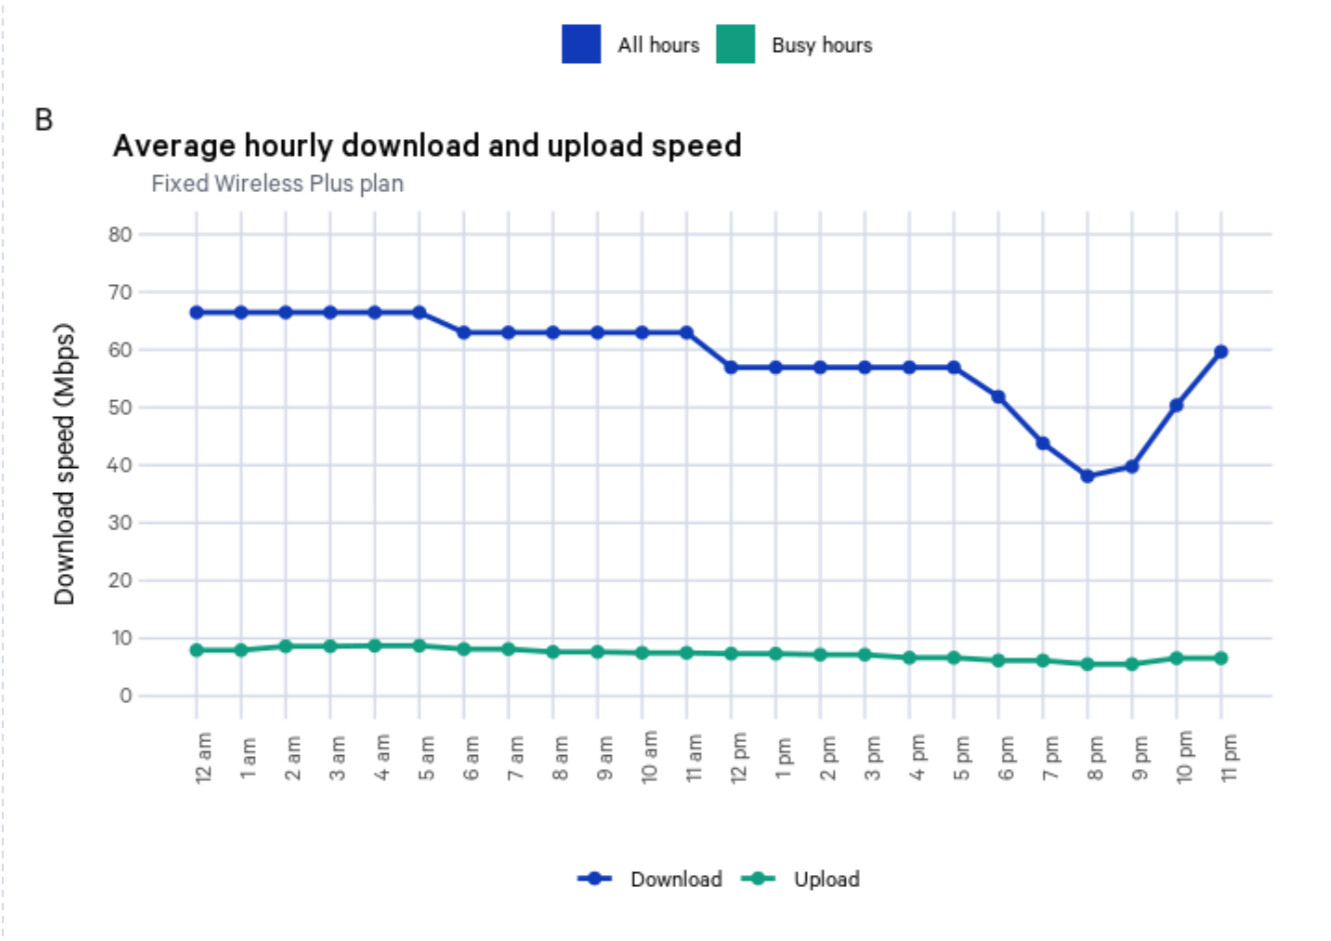
Of note the Fixed Wireless speed test performance results are skewed. There is a positive bias from the use of a 50/10 Mbps base to report performance of the majority of the monitored services. These can and do perform at speeds of up to 75Mps.
Reality for the Fixed Line services is many customers on FTTN technology have down graded speed plans. IE the NBN service connection cannot support the maximum speed plan available on FTTN. A white box installed on a down graded FTTN service avoids and will be less likely to report an under performing service. IE The results are only measured and reported against the current plan speed tier.
One benefit of the testing program is that it is easy enough to spot those who [do not purchase a lot of CVC](An NBN Wiki - #3 by grahroll) for their customers. If peak time speeds are a big fall off from non peak (disregarding here the performance of Fixed Wireless) then it is more likely that the RSP has not purchased sufficient CVC for their client base. They, the RSP, may be relying on that for most people most of the time that most will get a reasonable service and that during peak times some poorer service will be experienced. This occasioned poorer speeds will not generate enough momentum for the user to leave the RSP, is probably the RSP’s expectation and experience.
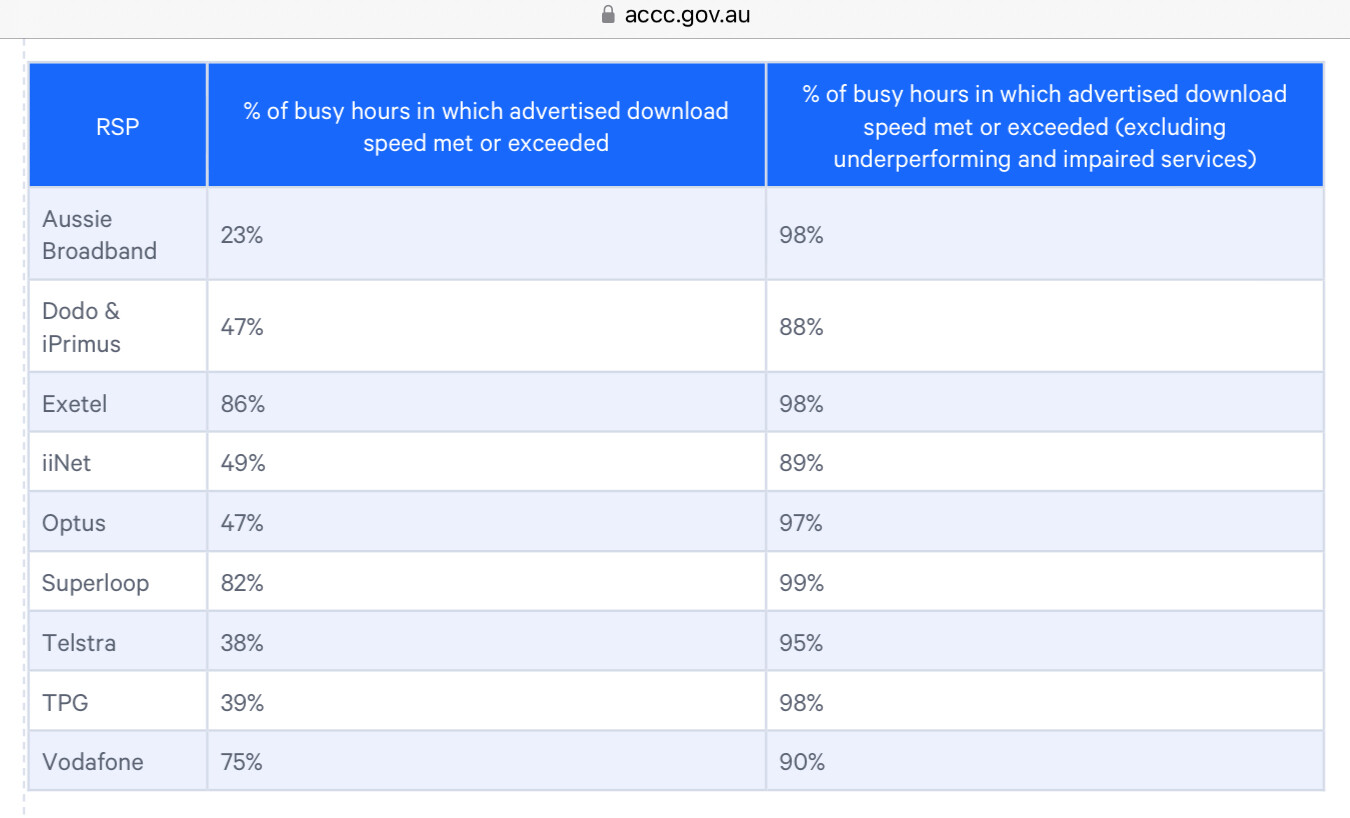
I had the same thoughts, but there is no way of assessing how representative the white box users are of an RSP’s customer base. I found the following in the appendix to the latest report for Fixed Line customers on 50 and 100 Mbps services.
Excluding ‘underperforming and impaired services’ may or may not provide the best comparison. How does one account for the differences. If it is only about CVC why not say so? Are there are other capacity (congestion) constraints for the Fixed Line NBN services? Is CVC a single purchase by an RSP that is location independent, or are the wholesale volumes purchased varied according to the POI.
As an aside, I’m grateful to have the benefit of an ACCC white box and monitoring of our NBN service. Is it constrained by CVC or congestion or both? For our NBN FW service through Aussie BB how would one find out all the facts? The NBN could release publicly the hour by hour, relative capacity loadings by cell and Microwave interconnects, to demonstrate when the system is capacity constrained. There’s only one NBN and for now it’s still on the public purse. Something the ACCC could force?
An alternative is to hope one of the other 85 nationwide NBN white box users is a near neighbour on the same FW cell, using a different RSP. At which point we could compare our monthly SamKnows reports.
Fixed Wireless would more likely be constrained by congestion and not CVC. CVC is usually purchased on a POI basis, as of May 2020 it could be pooled nationally by a RSP if they wish. It can also be moved to another POI if a customer base moves enough or it can be allocated temporarily but takes a little time for the transfer to occur. In peak times I would think the move time would not be viable as most people regardless of their POI location would be in similar peak periods.
So reality is that CVC for most fixed line services is the limiting factor regarding speed performance. As more people get on, the share of the allocated CVC becomes smaller and thus data transfers slow down as the user’s portion of the allocated bandwidth has shrunk. In 2017 the average CVC allocated per user by RSPs was close to 1.8 Mbps with a total average of 1.3 Mbps experienced for all combined RSPs. I wouldn’t think that these figures would have moved a great deal since then, maybe they approach 3 Mbps per user but I doubt that in 6 years it has moved this far. Almost no RSP tells the public how much CVC they purchased for their user base, and as it is considered Commercial in Confidence NBN Co will not publish it either.
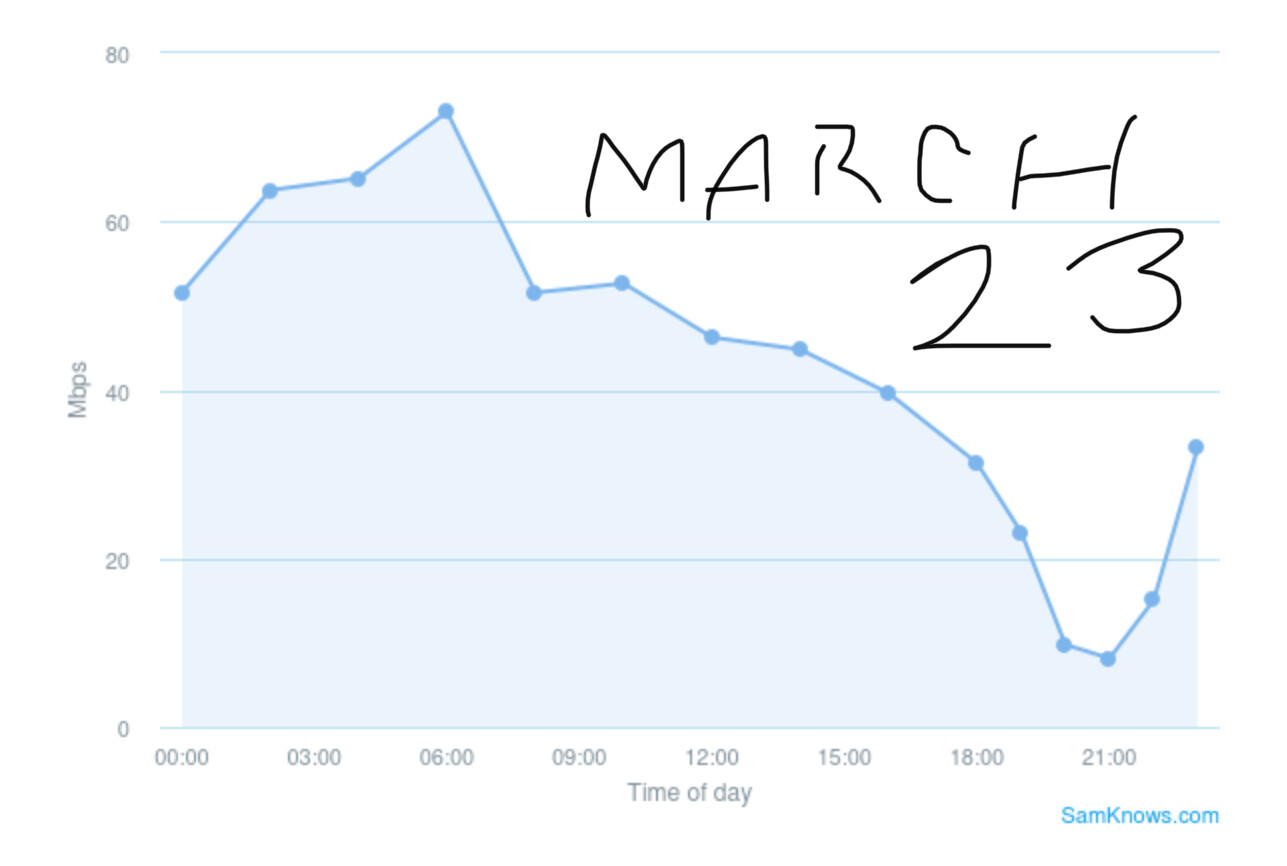
Aussie Broadband link their POI CVC graphs for all to see, this still does not reflect the number of users for any POI but the allocated CVC is shown as is the usage of the CVC. Towards 10 pm at night the speed is at it’s most affected for our area.
When looking at the graphs, the CVC used in total for any period is the sum of the download and upload, not just the more apparent download line. At some points this combined CVC usage may cross the allocated CVC line.
The reports focus on the positive outcomes based on averages. They lack a more succinct appraisal of how many customers are receiving a less than average performance. For fixed line customers there is a brief reference to under performing services. These for most RSP’s affect between 5% and 8% of all customers.
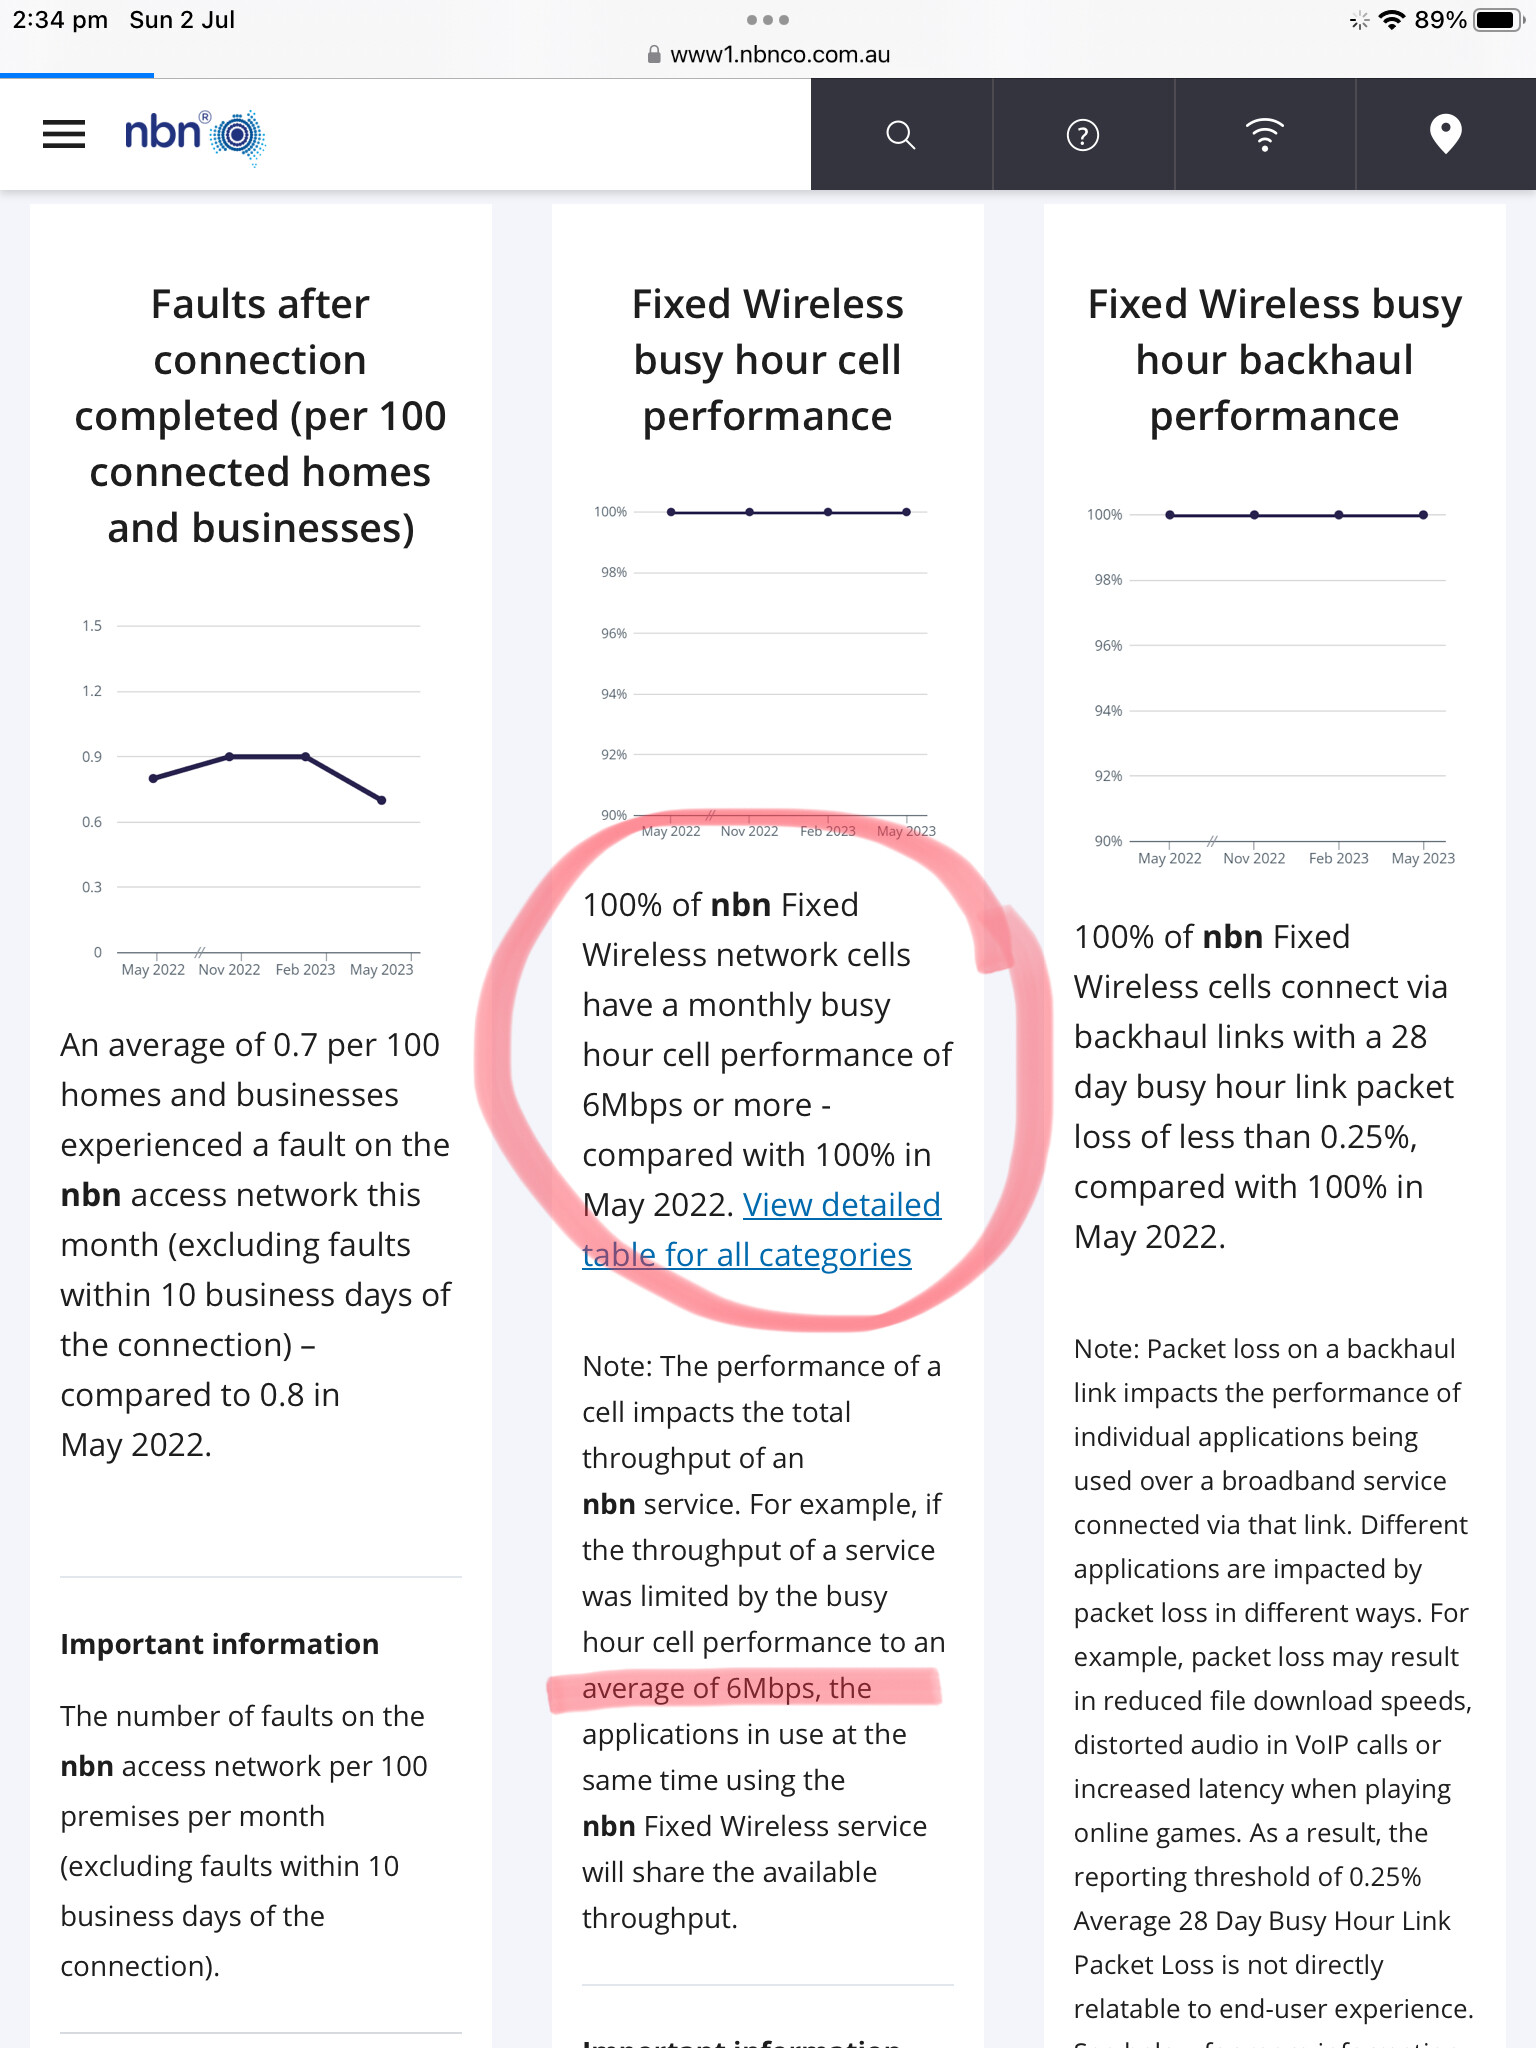
For Fixed Wireless NBN there are no reported under performing services. The ACCC in 2019 took the NBN to task on congestion of FW services. The agreed ACCC response was to set with the NBN a new and low bench mark. Still evident in the recent monthly update. Admittedly better than most on NBN Satellite could hope for. Barely better than many had on ADSL and copper lines.
Greater Transparency would provide the distribution plots for each type of service against the nominated speed plans for all NBN services sampled. The ACCC references confidence intervals and standard deviations, which is insufficient on its own to provide understanding of the issues around under performing services.
The ACCC report referenced data collected 01-31 March 2023. For the FW services averaged across the month.
A comparison offered from one of the white boxes included in the data set. Note this result is considered to meet the minimum standards agreed between the ACCC and NBN for a conforming service. Take it not as grumble about the quality of service we receive. Take it as an illustration of the short comings in the ACCC reporting. Similar omissions in the reporting likely for those on under performing fixed line services.
The “Great Australian Bite” if commenting on the quality of the service one is paying full dollar for. At least compared to those with a quality fixed line service that costs about the same.
Geography, in the great NBN lottery where one lives does matter.
This is true, for several reasons, but it is by no means the only factor. If you’re on FTTP, you have dedicated fibre from your home to the fibre exchange (or whatever they call it), then you’re multiplexed from there. If you’re on FTTN, distance from the node and quality of the connecting twisted pair are at least equally important.
In general, your comms are multiplexed all over the network, so there are a whole range of factors beyond the connection point. Including how much CVC your ISP buys, whether its proxy server is big enough…and so on.
These reports will give some broad brush information about each ISP’s general diligence, but not much guidance on your local performance.
I have FTTP via Internode. They’re owned by TPG. I don’t know whether TPG buys the CVC and shares it among its various brands, or if NBN is able to force each brand onto its own CVCs. I haven’t had any issues since I switched from FTTN to FTTP.
The reports are derived from “white boxes” installed at customers premises. There is one installed in our home. I volunteered to participate in the program. I was driven by the knowledge our service at best would be NBN Fixed Wireless. Included with the agreement is direct access to the data collected by the white box on our service.
The ACCC reports on the measured end user performance (experience) from a sample of each technology. This ‘broad brush’ reporting as you describe is a choice by the ACCC, assumed guided by the NBN Co executive and senior management.
For any one concerned their local (personal) experience is less than paid for. There are tools/apps such as ‘SpeedTest’ by Ookla. There are also speed testing tools provided by many of the RSPs. I need to log into our user account for access, and to generate a report accessible to the RSP.
The ACCC acknowledges in its reporting that there are underperforming services, and services with limitations (EG FttN). Its also self evident services such as Fixed Wireless provide variable performance. Unfortunately the ACCC has not gone the extra step of quantifying these outcomes, or pushing the NBN Management to provide greater transparency.
For Residential Customers of the NBN the fibre based services have the technology capable of delivering consistently the speeds contracted. The NBN along with some government spend is progressing upgrading many customers to the best technology (up to 2.5million premises).
The alternative technologies have lesser capability. Service performance is constrained by limitations on the speed of the technology as well as capacity. In approximate decreasing order of performance -by service type - HFC, FTTC, FTTN, Fixed Wireless, Satellite. Depending on who one chooses to believe the last 2-3 do not deliver broadband quality services.
Satellite NBN performance is not reported on by the ACCC program. Public feedback relies on individuals sharing their experiences. The ACCC reports on Fixed Wireless performance (averages only). The ACCC (report) appears to be satisfied and accepts the outcome serves the majority of NBN customers. Numerically around 80% is my estimate, noting the report avoids directly reporting the numbers and localities with under performing services. The NBN management however do know. The other 20% deserve to be better reported.
Well said. If you have a white box, you will certainly get accurate performance data on your service, but it won’t tell you where the bottlenecks are, or how the service is throttled/multiplexed. Fibre network speed limits are almost always in the terminating equipment. 20 years ago, raw fibre for a SAN would give you 2 Gb. They’re now dramatically faster than that. The fibre hasn’t changed, only the terminating equipment. Then there’s network priorities and applied bandwidth restrictions. These are software parameters, and that’s how CVCs work. The line might be running at 20% throughput capacity, but if all the traffic is from an ISP that paid for 15% of the line capacity, it may queue packets to contain the CVC traffic to within its lane (in order to “convince” the ISP to buy more dedicated bandwidth), or it may (in software) choose to let it all through, track it and alert them that they need to buy more bandwidth or risk throttling.
Your performance scale quite right, although FTTC and FTTN are highly dependent on distance from the node and quality (# joins) and age (insulation hardens and cracks) of the twisted pair. Fixed wireless will be a combination of distance from the tower and number of active connections and activity. Satellite broadband is going to be similarly limited and probably expensive.
NBN almost certainly has extensive network monitoring with logging, along with load balancing software. The monitoring software would put alerts up on the network maps.
NBN management would certainly know where the performance constrained parts of the network are, and the causes. With NBN, “serving the majority” might not be good enough, and 80% is probably far too low. That 20% deserve to know when their service will improve.