Breaking news folks.
Sky News has uncovered computer bots created over 1,000 fake names on Kevin Rudd’s petition.
Pity about the other 500,000+ names.
Breaking news folks.
Sky News has uncovered computer bots created over 1,000 fake names on Kevin Rudd’s petition.
Pity about the other 500,000+ names.
That is what I define as an oxymoron.
Peta Credlin forced to aploogise to Kevin Rudd.
" I’m pleased to say that Murdoch’s Peta Credlin – the Liberal Party mouthpiece masquerading as a journalist – has settled my complaint against her for defamation. The terms are confidential, but here’s the on-air apology for her false claims on Sky News. #MurdochRoyalCommission"

The sad thing is the other end of the political spectrum is also not immune to making silly non-factual claims.
Some extremists are merely intemperate and say the first thing that comes to mind to score a point without checking, some know they speak falsely but have faith their deity will forgive them the lie. Then there are those whose stock in trade is the outrageous who self-insure against law suits because all the mad claims they get to air without being sued are gold.
Did somebody say Mediscare?
The organisation Getup! have helped fund a report into Media Diversity in this Country. If you wish to read the report it can be found at (the link will most likely need to be copied and pasted into a Browser):
https://d68ej2dhhub09.cloudfront.net/2810-GetUp_-_Who_Controls_Our_Media_.pdf
The Key recommendations from the report are found on page 8 of the report but are posted here for easy reference
KEY REPORT RECOMMENDATIONS
An ACMA with teeth
The media regulator, the Australian Communications and Media Authority (ACMA), be provided:
Enhanced legislative authority that secures independence and its capacity to use its investigatory powers at any time
Adequate funding to independently carry out its duties, functions, and responsibilities, including increased monitoring and reporting on the Australian media and communications sector
A mandate to conduct periodic plurality reviews and monitor and publicly report on media market status and developments, including detailed information about revenue, expenditure, and ownership of Australian media outlets
A mandate to request information from media organisations about ownership, revenue, and shares across platforms
A mandate to impose new transparency requirements, including a public register for politicians to document every meeting with media executives and owners during their time in office
Overhauling media ownership laws:
An overhaul of media regulation changes that have effectively entrenched media concentration, including the 2017 repeal of the two out of three rule
Reintroducing caps on single-media and cross-media ownership in specific geographical markets, with exemptions in exchange for enforceable public service obligations — for example, the delivery of local news
Public investment in news media
Incentives to encourage alternative models of media ownership, such as cooperatives and nonprofits
Introducing a new tax rebate scheme and charitable status for news organisations producing public interest journalism
Direct ongoing press subsidies to support pluralism in local and regional media markets
Adopting the ACCC’s 2019 Digital Inquiry recommendation to impose a levy on big tech companies that can return new funding opportunities for diverse organisations producing public interest news
Reversing the drastic reductions in public funding to the ABC and SBS
A report that may even get CHOICE’s approval on need for action?
A new report into News Media including Social Media type outlets eg Facebook produced by the News & Media Research Centre of the University of Canberra and hosted at https://apo.org.au/node/312650.
The report has some interesting stats to be delved into including how socio-economic status is affecting where and what news sources are believed or accessed.
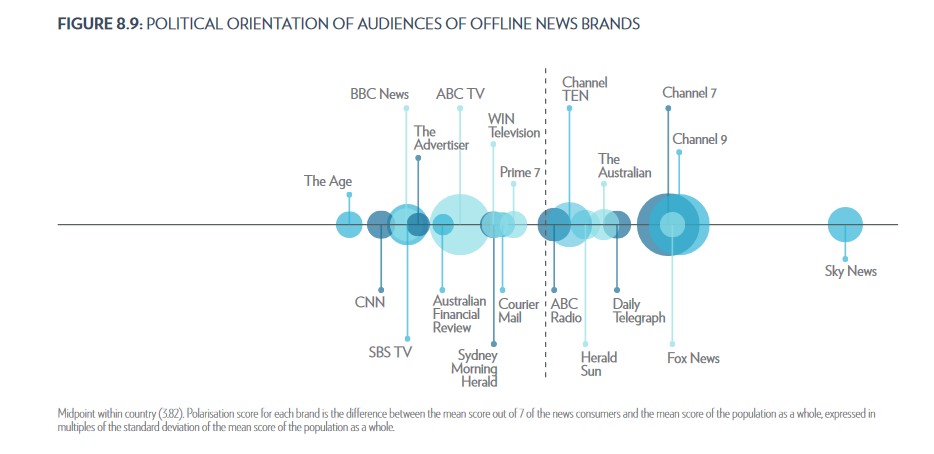
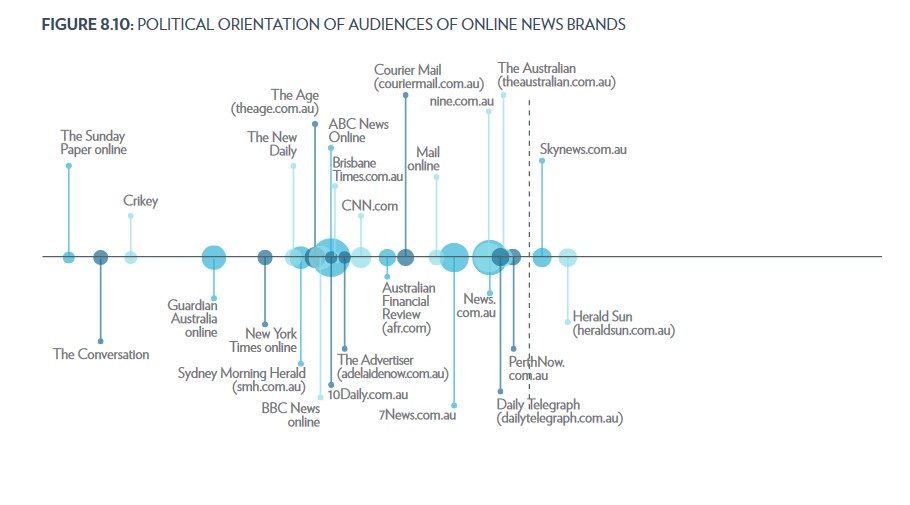
A couple of snips from the report showing the political leanings of audiences of News brands
Other reports including the other yearly Digital News Reports produced by the News & Media Research Centre can be found at
No surprise that Sky is the worst im offline.
Big surprise that Sky is only the second worst online.
Great to see that the ABC is close to the middle contrary to what many might expect.
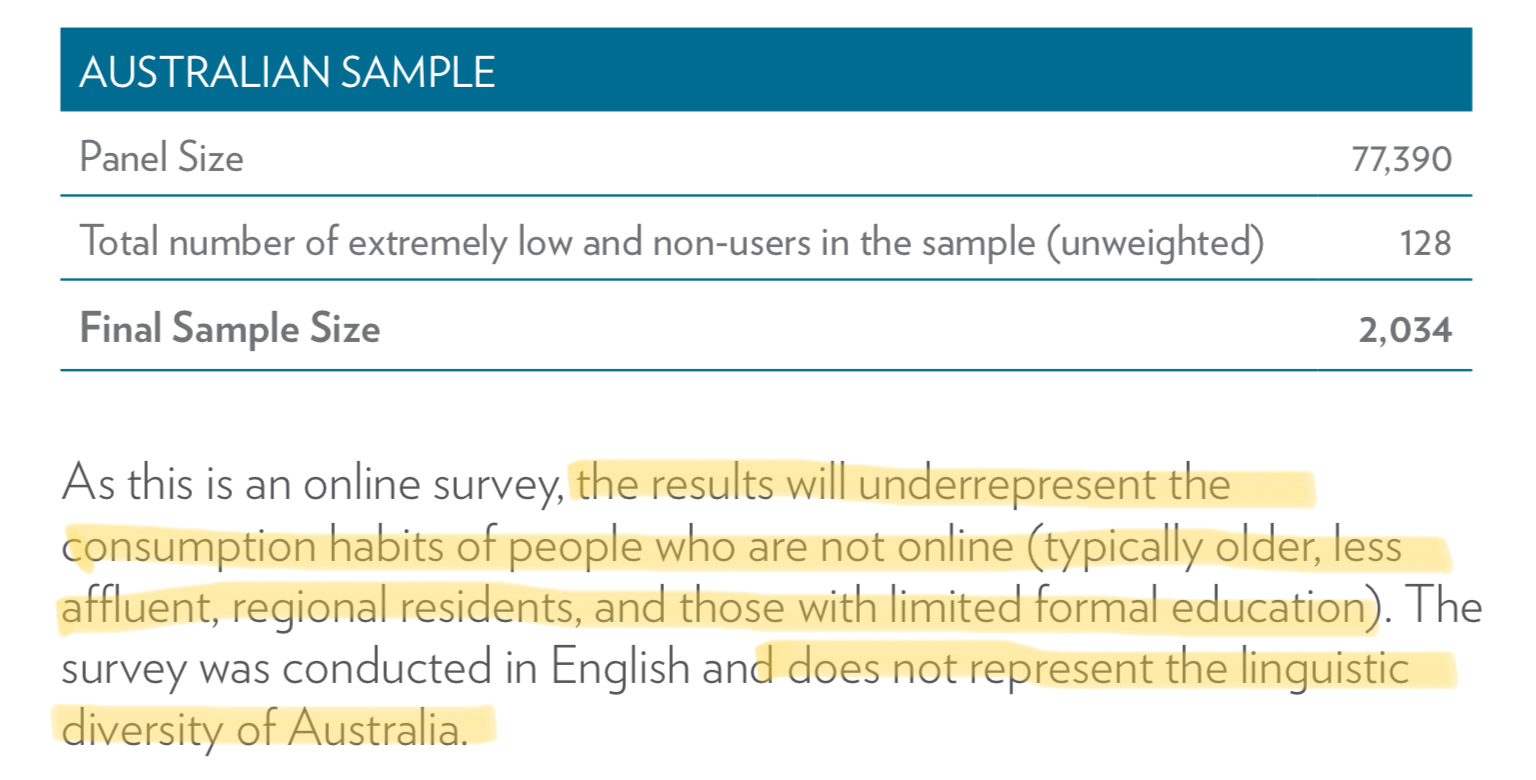
I’m a little unsure that the survey result should be relied upon. Note my highlighting from the ‘methodology’ description.
It makes some broad assumptions about who is not represented by the survey. Given the exclusions, could we take the survey to represent only the views of a more educated, urbanised and whiter Australia?
Experiences of living and working outside that profile for a significant portion of my previous 40 years. The profiles presented are likely biased/skewed one way.
I think you are mixing up two meanings in your comments. The ABC has been accused of bias towards the left in its reporting, typically by the right wing media and commentators. Whether they are biased is another matter as it may be politically convenient to attempt to decrease the credibility of your critics by accusing them of bias or they may be biased.
The charts do not claim to represent a measure of bias in reporting or the political orientation of the media outlets but the distribution of the self reported political orientation of their readership. So those who say they are right-wing are more likely to read Sky offline and those who say they are left are more likely to read The Conversation online.
As for Sky being the “worst” I don’t see how you come to that conclusion. We may say that degree of bias or truthfulness is better or worse but I can’t see how we can sensibly talk about position on the spectrum being better or worse.
I am puzzled by the second chart. The scale is described as:
Midpoint within country (3.82). Polarisation score for each brand is the difference between the mean score out of 7 of the news consumers and the mean score of the population as a whole, expressed in
multiples of the standard deviation of the mean score of the population as a whole.
What do the sizes of the spots mean? I am thinking the number of readers but it doesn’t say so AFAIK.
What does the dotted line mean? I expect it is the mean score but it doesn’t say so AFAIK. If that is so how is it that in the offline chart the mean is about the middle but in the online chart it is way to the right?
Which leads me to a general observation that many of the charts in this publication are inadequately described. There are many bar charts but AFAIK none have a scale in the direction of the bars. This matters as without it the meaning of differences becomes harder to understand.
For example, some charts have a base value of zero and some above zero. The second category tends to exaggerate differences. If you are comparing two bars with values of 81 and 84 the difference looks much more if the scale starts at 76 than zero. This kind of presentation tends to bias the interpretation of whether 81 is a significant difference to 84, especially as sampling error bar are not provided.
I think as the years are compared the results can indicate a trend. On it’s own the results can be a bit ambiguous but over time the measurements are very likely are able to show the trends more accurately. The last link provided allows any viewer the option to download and review each yearly report and thus compare across all the years the metrics.
If anyone has issues with methodology of the report’s sampling and graphing I suggest that contact with the Centre could prove worthwhile. They should accept constructive feedback to improve the report, I’m also sure they would be grateful for it.
Where was the broadcasting regulator when Sky News Australia was airing misinformation about Covid-19?
Good question.
![]()
Rudd calls out The AMCA.
‘meow, meow’
Kevin, it’s a pussy cat and definitely not a watch dog.
At least from my one prior experience.
P.S.
I’m being polite. I thought more a lap dog at the time.