High grid voltage problem for PV system exporting

SUMMARY
Many rooftop PV systems around the country are having their output restricted or being cut off completely due to high grid voltage.
This is costing PV system owners money in a double whammy: lost income from energy exports (grid feed-in), and also having to unnecessarily pay for imported energy when the inverter is shut down due to over-voltage.

The Australian standard has been 230V since 2000, yet many houses experience near 250V much of the time. This leaves little leeway before inverters shut down due to over-voltage.

The operators of the grid at local street level require solid evidence before they will take action to adjust voltage to more inline with the standard.

Monitoring of your system is one way to gather the required evidence for a remedy.


Here is my experience with fixing this problem for my brother.

Often you hear of people who think that solar power is a rip-off, with claims that power bills have not reduced, or even increased, since a PV system was installed on the roof. I’m pretty sure that none of these people have decent monitoring of their system, so they are unable to determine what is going on.

Of course there are factors other than high grid voltage that can contribute to low or zero power being produced- panel shading, poorly located hot inverters in direct sunlight, water filled rooftop isolators, badly made or corroded connections etc. Monitoring will alert system owners to all of these issues.

However, for systems that are properly functional the major cause for poorly performing systems has to be high grid voltage. Inverters reduce output, then shut down completely when grid voltage gets into the 250-253V range. 253V is meant to be the upper limit, 230V + 10%.

A number of analytical companies and various studies have shown via their monitoring across a large number of PV systems around the country, that the majority of systems experience voltages well above the Australian standard 230V. Very few experience low voltage below the minimum standard of 216V (230V - 6%) these days.

My NSW Central Coast dwelling brother recently had monitoring installed at his house, which has a 6.4kW PV/5kW inverter installed on one of the 2 phases connected to his house. He asked me to look into and see if I could sort out his system’s less than optimal performance issues.

The sampling interval of the PV system and various circuits shown on the web-based graphical display is 5 minutes, which hides the full extent of the problem. Certainly dropouts that last an extended period show up, but the multiple inverter restart attempts are hidden by the rather coarse sampling. Even so, it was clear that once exported power levels were up around 2.5-3kW, the inverter throttled back or shut down completely, often for hours on end. Not only does this mean loss of feed-in tariff, it means that grid power is being used to run household loads, which could have easily been covered by essentially free power generated on the roof- unavailable due to inverter shut-downs.

In addition to the graphical display there is a 5 second sample rate numerical display of the power levels in the 6 current transducers, plus grid voltage, measured at the switchboard at the front of the house. Watching that I could see that grid voltage was around 250V or more for much of the time, even overnight when there was no solar input. It was clear to me that the transformer needed to be set to a lower voltage tap on the output.

Discussing the issue with an electrical engineer at Ausgrid revealed that they do not have low voltage (415/230v) transformer voltage monitoring at all, and are essentially blind to what voltage their customers are experiencing. My suggestion that the transformer near my brother’s house needed to be adjusted to a lower voltage tap brought the response that they were concerned about low voltage at the end of the line. This, even though they had no evidence that it might be an issue!

Apparently something like 200 houses are supplied by the transformer, which is located quite close to my brother’s house. The engineer also suggested the problem was related to the solar power system at my brother’s house, raising the voltage too much. It was suggested that we check the settings on the inverter.
That was done, and the maximum grid voltage setting was adjusted up 3 volts to 258V. This allows for up to 5 volts rise in the cabling between the inverter and the front switchboard due to resistance in the wiring, which was 6mm^2 from inverter to the house sub switchboard, and then 16mm^2 to the front of the house. At the power levels involved, this size cabling is more than adequate to avoid voltage rise issues of any significance.

In any case, after the inverter settings were adjusted I could not see any improvements. Clearly the grid voltage was too high to begin with.

From my frequent monitoring of the 5 second voltage data, I knew that the voltage was often around 250V at night when no PV systems were exporting any power, so that the issue was definitely not due to my brother’s power exports. There are only a couple of other houses near my brother’s with small solar systems, and I suspect they may also have been experiencing inverter drop-outs, but probably don’t realise it due to not having monitoring. I am certain that this is the case for tens of thousands of houses across the country.

After some back and forth with Ausgrid, they agreed that they would consider a tap change on the transformer if I could provide evidence that the high grid voltage problem was not due to the exporting of power from my brother’s PV system.

So it was back to the monitoring company, with whom I’d had some discussions and correspondence up to that time to sort out some monitoring set-up issues. I requested voltage logs for both phases, along with the power levels from the various CTs for an extended period, and hopefully I’d be able to extract enough from that to convince Ausgrid.

The voltage log showed the maximum voltage during each 5 minute period, rather than an average, which may have hidden the peaks, however, the high voltage periods were sufficiently long anyway. The voltage showed some significant fluctuations- rather more than the stable voltages Ausgrid had suggested would be the case. I was able to plot some voltage traces showing high voltage on both phases, day and night, and since one of the phases did not have any PV system connected to it, it was enough evidence for Ausgrid to adjust the transformer. My reading of the data suggested that loads coming on and off were a much more significant factor than PV systems for the voltage fluctuations.

Graph of data from a day in mid August showing grid voltage, labelled Vgrid A - no PV system connected, and Vgrid Solar which has the 5kW inverter connected to it. The red trace shows gross output from the inverter, actual exports being fed to the grid are always less, due to self-consumption loads in the house.

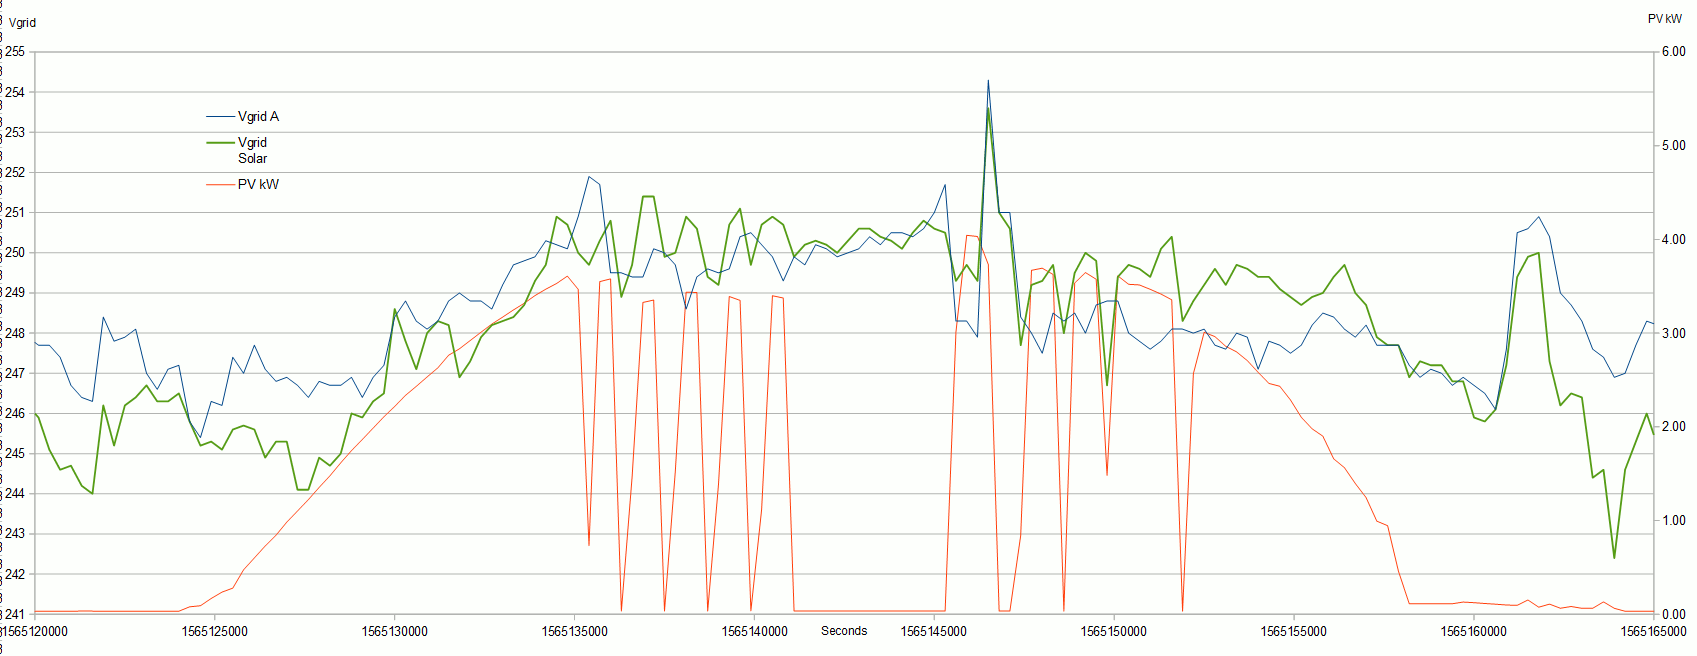
Seconds on the x axis start from 1970! (that’s just how it came in the log file)

Note the voltage increase on both phases a bit after midday- to around 254V, plus the significant voltage excursions in both phases after the sun had set.

The 5 minute sampling interval means that the period through the middle of the day when output varies enormously doesn’t show a truly accurate picture of the durations of dropouts, or any attempted restarts. Voltages shown are the maximum during each 5 minute period.

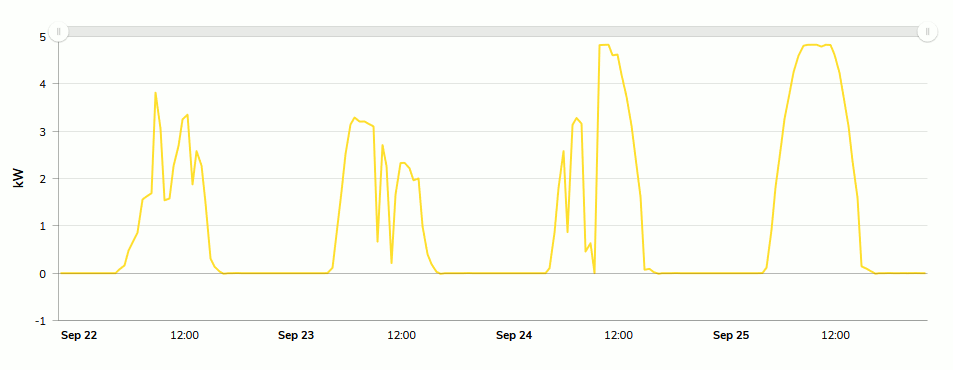
This plot of gross inverter output shows the effect of having the grid voltage lowered to around 240V before midday on 24th September. With no more throttling and dropouts, it now functions as it should!

It is difficult to calculate with any accuracy how much this might be costing people over an extended period, but with complaints of no or minimal bill reductions after PV system installation, whilst others wipe out their entire bill, it can clearly be a significant loss. I encourage those with PV systems to have a good monitoring system installed- that will be the first step in discovering how your system is performing, and whether or not high grid voltage is costing you a significant amount.

12 Likes

I’ve noted similar. And all may not be as expected.

What the standard says and what is actual practice are not the same.

Unless legislated compliance to a standard may not be enforced. While enforcement may also not be rigorous.

Each state is different, well at least Qld, although I recollect reading the others adopted different timelines.

https://www.dnrme.qld.gov.au/energy/initiatives/statutory-voltage-limits![image|375x500](upload://grD4JSNoX0v1JT3AjucG2AkevCf.png)

Qld only moved to the 230V standard as of Oct 2018. IE 216V - 253V if that is of interest.

Also of interest is the stated ‘aim’, note this is not a ‘must’ to achieve a tighter 230V +6/ -2% in 2020.

I can only comment that the situation looks rather dire for those exporting solar where the local line regulation is poor.

Notes:
The local distribution systems are designed on an assumption of progressive losses between supply and customer. Solar PV requires a different operational strategy for the local network. It may require solutions that include additional monitoring points across the local network, and additional automatic/controlled tap changes. This is essential to maintain supply system voltages within limits and to maximise solar generation.

This was arguably foreseeable based on the forecasts and budgeted govt support for solar PV.

Our observations are that for one urban area of Brisbane, voltage levels appear to be well managed within the standard even during peak solar PV in the middle of the day. For a more rural area on the Sunshine Coast the voltages are in comparison typically higher by approx 10V, rarely dropping below 250V. High PV uptake, long local lines and few high demand daytime loads likely influence this characteristic. That the evening and predawn line voltage is still close to 250V suggests there is also another non PV factor only Energex can explain?

7 Likes

What hardware and software did you use for monitoring?

4 Likes

Hi Nigel, Auditing device and cloud based monitoring from Wattwatchers.

4 Likes

Got it, thanks for letting me know!

3 Likes

Interesting discussion. Thanks @gordon for the details you provided. FYI the broader issue of the grid struggling with the volume of domestic solar PV now out there is recognised in a recent report by the AEMC - media release and report link here. Voltage issues are the main problem. The report identifies that there’s a lack of detailed monitoring information at local levels and that’s one of the items to be addressed in future-proofing the grid.

9 Likes

At the moment it is an almost invisible problem, most consumers don’t know it is happening (a PV system is set and forget isn’t it?), and the network operator doesn’t have the monitoring to see it either. Maybe that’s the way the network operator likes it!

7 Likes

Not invisible at our place as I check the inverter and electricity meter every day so I will soon know if we are not getting our FIT.

4 Likes

Is it any different for the retailers? In the supply chain, there are multiple interested parties, including several state governments which still own their assets. Transparency is a rare thing in the industry.

Comment:
I’d like to suggest that the issue of poor line voltage regulation and high voltage is less of a concern at present in high density urban areas, compared to more rural and low density parts of the network.

The cities may have the benefit of substantial daytime demand throughout local areas, shorter distribution lines, lower levels of PV generation relative to peak daytime demand and better substations/network control. It’s only a guess based on a sample of one, although I noted a second sample point

The lower density areas including outer urban appear around here to have much higher uptakes of PV, large roofs to maximise system size, fewer opportunities for high load users to absorb PV output within the same segment of the network, and older equipment with more basic regulation strategies. Many properties are also unoccupied during the day, or for longer. There are also more properties on three phase which provides for higher capacity PV systems. More if you are primary producer.

6 Likes

Are you sure your inverter isn’t throttling its output at any time? You can’t determine that by looking at totals once per day.

5 Likes

I’m not so sure about that, the case I discussed above is in suburbia, not a rural location. My brother is going to 3 phase soon, and installing a Tesla charger at his Airbnb.

5 Likes

I actually look at it many times a day in the absence of anything more important or interesting to do.

I have noticed with some surprise that recently it generally flat-lines at around 4.5kw and the bar graph on the inverter display looks like a pyramiad with the apex cut off horizontally.

Not long after it was installed in February this year, I observed it actually producing just over 6.8kw on 2 occassions, and recently, just over 6.6kw, and as the weather has substanially improved to the point where we actually exported around $15 more than we imported last month, I was surprised that it rarely exceeds 4.5kw except yesterday which was a lousy day when I saw it topping 5kw.

So we have a 6.6kw system with an LG RESU10 battery which is generally producing 30kwh to 34kwh and exporting 16kwh to 22kwh on most days recently but rarely reaches nameplate output, so yes, I did wonder if some external factor was influencing its performance.

But there is definitely nothing stopping it exporting surplus power at anytime it is generating.

3 Likes

It’s quite possible it is more general than I was suggesting. Given the lack of public data we only have four samples so far.

Is the next challenge finding a comprehensive source of relevant performance data?

4 Likes

Solar Analytics have collected a lot of data regarding grid voltage, and if I recall the mean voltage was somewhere around 249V (I can’t remember what area that was for).

Nige, who posted earlier, may be able to give us a bit more info about that.

5 Likes

Great post, thank you.
I am wondering what is an easy way for a normal member of the public (without a lot of electrical knowledge) to establish:
a) if there is a significant problem with their PV feed-in and hence money returned by the electricity authority
b) enough information about it to convince the electricity authority to do something?
I am in suburban Perth

5 Likes

If your inverter has logging ability, you should be able to see what the voltage and output power looks like over the day, although generally they aren’t super accurate. It would give you some indication of any problems though. It may be sufficient, but a good quality monitoring/logging system might be the only way you’ll convince the network owner of a problem if they aren’t inclined to do anything, as generally you’ll need solid evidence before they will look into it or take action. Sometimes they will connect their own voltage logger to see if your voltage is within limits, but as in my brother’s case, they wanted evidence of high voltage with no contributing solar power exports.

4 Likes

I had a 5kW rooftop system with a Fronius inverter installed in our suburban Mackay house 2 years ago. As I retired process engineer I made sure the inverter had full system tracking and reporting. The daily system reports immediately showed my inverter being cut back because of high Ergon grid voltage up to 80 times per day. When I complained Ergon did a check on the nearest Transformer. Ergon then told me the local grid voltage was within their allowed band of 240 +/- 15% ! And they would change nothing. The other side of that is that on overcast mornings the toaster has to be run up to 3 times to get acceptable toast due to low voltage. I don’t know what that does to all the other electrical items in he house. Just counting roofs our suburb has around 20 % roof top solar. The only defence I can see is that top line inverters like the German Fronius reduce their output rather than shut down completely when high mains voltage is detected. This is one of the no doubt many hidden issues for consumers as electrical infrastructure designed only for continuous base load power input is loaded with more and more intermittent local power generation they are just not designed for.

9 Likes

Given your obviously low voltage on overcast mornings, I suspect that one or more of the following apply:
The transformer is too small for the load, there are too many houses connected to the transformer, or the cable is too small, resulting in a large voltage drop at the end of the line, or voltage rise when lots of solar power is being exported.

Ergon seem rather generous and totally dishonest with their claimed voltage limit allowance! The Australian standard is 230V +10%/-6%.

I suggest you point them to this page:

In particular, these bits:

…when we use the term ‘230 volts’ we mean 230 volts (+10/-6%).

Queensland’s Electricity Regulation was amended on 27 October 2017 to mandate a transition to the 230 volt standard in Queensland.

By 26 October 2018 our network electricity supply voltage limits will transition from 240 volts to 230 volts as per AS 60038.

From 1 July 2020, we’ll maintain network supply voltage within the preferred voltage range set out in AS61000.3.100 (Steady state voltage limits in public electricity systems). This sets an 8% ‘preferred operating zone’ (between 225 and 244 volts) within the allowable range (between 216 and 253 volts).


Their claim of 240V +/-15% is clearly garbage!

8 Likes

IMO, it is imperative that a rooftop system be monitored on a computer. most inverters have an output that you can feed into a computer. On ours, I can even see if there is a reduced output caused by a blob of bird poo etc. I check every night to make sure of a proper output for the weather conditions and whether there is anything out of the ordinary going on!

6 Likes

Thanks Gordon :slight_smile:

6 Likes