It’s all very well to shop around for the best energy prices, but I’m in an apartment complex with centralised gas hot water boilers, and although each owner is billed separately we can’t switch energy providers individually. I’ve just been informed by AGL of a ‘change’ (i.e. increase) in the gas H.W. rates from the 1st of August.
Will just have to use more cold water, and it is winter in Melbourne ![]()
1 Like
How do they work out the gas bills for each unit? Our experience of other common services is they are divided as an equal share between all owners. The low volume users subsidise the higher volume.
1 Like
Put very simply (and roughly) near the boilers there are separate meters for each apartment which register the volume of hot water that has passed through them. From that they work out how much energy has been used to heat such amount of water.
BTW the method you describe is used here for the water usage, it’s divided equally between the apartments no matter how many people are in each apartment, and what actual usage there’s been.
1 Like
An observation about AGL as well as the market. Retailers profits and the faux vision of competition were supposed to assure pricing was sharp. Instead some think management and systems have been replicated adding unnecessary costs to a basic necessity, off-shore companies lined up to partake, and it is left to consumers to ‘shop around’ in a field of purposefully confusing offers.
2 Likes
A similar observation from the ABC report, to my experiences.
In the ACCC’s most recent report on the electricity market, it noted not even government-run energy comparison websites reflected the true cost of bills.
Having done the sums manually over several days, it’s as the ABC says. And in greater detail than we need to repeat here.
I have found the Victoria site to be fairly accurate +/- a level of noise against my own spreadsheets for electricity and fairly close for gas.
Where it sometimes fails is that there are often timing delays between offers being posted on the Vic site and removed from the retailer site and so on, making it sometimes tedious to get what you want.
I recently received advice from Red Energy as to the wicked electricity price increases that would be inflicted upon me as of 1st July 2023!
I rang them up and waited patiently in the queue, listening to the pre-recorded message issuing me with the excuse for the long delay in waiting for my call to be answered… viz “we are experiencing higher than usual call volumes and apologise for the delay… blah blah bollocks”
Well of course they are experiencing higher than usual call volumes after the latest outrageous price hike.
After about 20 minutes of suffering the ghastly and distorted music on hold, my patience became exhausted and I sent them off an email instead, complaining about the price rises and asking if they could offer me any sort of better deal?
As a fully fledged pessimist, I fully expected my grumble to be unceremoniously hurled into the great abyss of unwanted drivel from malingerers and discontented whingers!
To my great surprise, they rang me back a few days later and offered to put me back on my previous plan - ie same charges as before the price rise!!!
That’s why I am a great advocate of pessimism.
You see, an optimist can never be pleasantly surprised!!
BB.
2 Likes
Thanks for that very comprehensive reply, PhilT. I’m aware of the iSelect and comparethemeerkat business models, but thanks for that warning. I’m just so shocked by the 40% in one fell swoop.
1 Like
A nice $250 arrived in my bank account the other day for spending 15 minutes on the Vic Gov electricity compare site. Didn’t even bother looking at the comparison prices.
For that I go to my current supplier and see what their latest deals are, and then to a few others. And update my spreadsheet.
1 Like
Surely the business models of these companies means that all consumers are paying for them. Do they not receive a “kick back” or commission for their service when a customer is signed up. This cost is effectively being paid by all consumers in higher prices as for the energy retailer it is just an amalgamated cost of marketing and allowed to be taken into account by the regulator in calculating the cost of running the business. I note that when I try to negotiate prices with retailers they will NOT give me a discount for dealing direct rather that the retailer paying a 3rd party for my business.
How are retailers allowed to put up the price 72% in one go as Momentum from Aug 1st? When checking around other retailers are doing similar increases. It is the same for gas.
I received my ‘love letter’ with a 67% increase based on my actual trailing use. It surprisingly was not so different from the retailer’s estimate of the increase. Shopping around had what appear to be only 50% increase offers BUT beyond the basic numbers the games have ratcheted up a few notches. This is for my grid operator in Victoria and might not apply elsewhere.
- peak time was previously 7am-11pm for most (not all) retailers. Now peak is usually 3pm-9pm 7 days. How that affects how we live and use energy remains to be discovered.
- there are lots of offers including ‘cash credits’, ie get $$$ credit on your bill(s) but from higher rates.
Plugging everything into a spread sheet gets tedious and for the next few weeks sites like compare.energy.vic.gov.au don’t uniformly flag rates on 1 Aug yet, although reading the returned offers is instructive as some (not all) have notes about the upcoming increases.
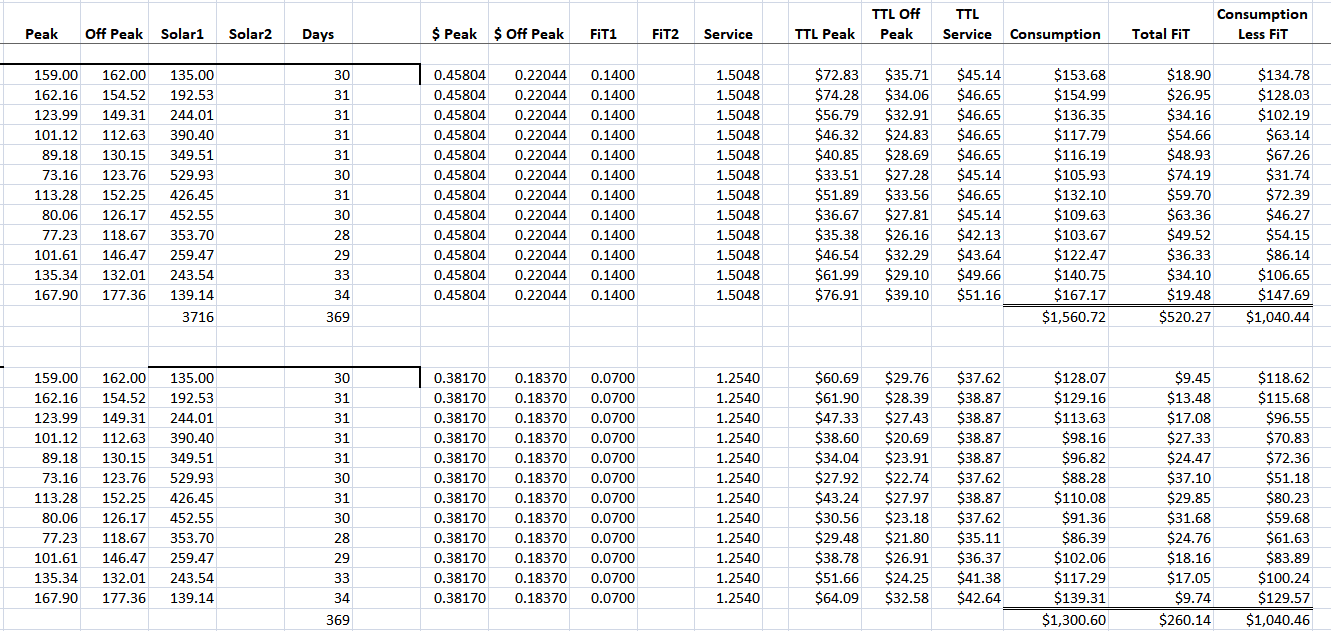
One company has two plans with significantly different profiles. The first has a much higher daily rate, much higher peak rate, and much lower off peak while the second plan has a lower daily rate, lower peak rate and very high off peak rate. My spreadsheet suggests they would be separated by less than $2 p.a. eg noise.
A conclusion is the energy industry has moved on from faux competition to overwhelming us with variables to make it near impossible to understand it without significant attention and focus, even with the best comparison sites out there to help us. A few days into August when all the rises have been filed and the compare.energy site should once again at least provide clues to the real top offers.
1 Like
I found this almost predictable but humorous at the same time. Two disparate plans from the same retailer using the same usage data. The difference between them is a few cents with the wild card (punt) being whether Melbourne is less cloudy over the coming year to up the FiT. The 369 day year is an artefact from data collection as I changed retailers over the year.
1 Like
Good news?
The headline is attention grabbing. It would be less so if it was qualified to say ‘wholesale electricity prices’. In context of typical retail bills the ‘down 60%’ is likely closer to a 10-15% reduction.
It would be meaningful and informative to have comparisons with the previous years costs and the most recent price price increases faced by consumers.
‘Electricity profits skyrocketing’ despite falls in wholesale pricing, an alternate headline?
As an aside from the report.
All up the fossil-fuel plants contributed about 64.4% of NEM supply in the quarter, down from almost 68% in the June quarter last year.
The share of renewables might have advanced even more if not for limits on grid capacity. About 61MW of generation on average was lost from solar and wind farms for the quarter, up from 41MW a year earlier.
1 Like
No surprises here, but complaints to Fair Trading about electricity providers has been skyrocketing:
I like many saw my domestic power bill jump by 23% last July.
This prompted me to dig into my filing cabinet and pull out all my power bills since October 1990. I was curious to see how the unit price of electricity had changed over 33 years.
Also, when discussiong with family and friends, I realised most people have very little or no understand on how electricity is metered, let alone delivered to their homes.
I did a fair bit of research into this and as a result created two youtube videos, one explaining how the electricity is delivered to a residental home and metered, plus how to read an electricity bill despite it’s confusing and contstantly changing terminology and lastly I show a Flourish Race Chart which begins in October 1990 and clearly shows how the unit price of electricity has changed over time.
In the second youtube video I take you through how to use the free federal government website called Energy Made Easy, which allows you to access your own electricity usage data in order to find a cheaper retailer.
I have also published the Flourish Race Chart on their website, so anyone can view it.
One of the mysteries I could not find an anwser for was the fact that up until 1st of June 1996, the only charge on your power bill was how much electricity was used by the household. After 1st of June 1996, a new daily service fee was added to all power bills. I could not find any reference to why or how that came about, if anyone knows, it would be nice to clear that up as well.
If you are interested in learning about how the electricity is delivered to your home and how it’s metered, then check this youtube video out… https://youtu.be/_c3biAfHp1E?si=FdOP3XguGZSMEPOq
If you didn’t know about energy made easy and would like to see how to use it in order to find a cheaper retailer then check this youtube video out… https://youtu.be/fLLE3Q-xErc?si=DprlPp6w3TAxXuXp
If you are only interested in the Flourish Race Chart showing how the electricity price in NSW has evolved over 33 years, it is available here, although my first youtube video goes into more detail on it. https://public.flourish.studio/visualisation/15737188/
If you do know why the daily service charge came in, by all means put in a comment
4 Likes
@simmi, Thanks for your efforts to track electricity prices. Your post caused me to merge a few related topics dating back to 2017 as well as a few about gas.
After privatisation governments decided that we need to understand who was getting what in our once upon a time consolidated energy bills. As you indicated once the bill was simply ‘power’, and now includes ‘usage’ often in steps of some sort, sometimes a ‘demand’ multiplier, then ‘network charges’ and the daily ‘service fee’.
Most of us are somewhat sceptical since the myriad line items seem gamed to confound attempts to compare offers so sites such as energy.compare.vic.gov.au came about, with other states left to energymadeeasy, both to try to put some focus on reality as compared to those sites that spruik and compare only their own stakeholders or retailers that provide them income through commissions.
3 Likes
The QLD Govt explains it thus ( through their electricity generators)
“The service fee is set by the Queensland Competition Authority and covers the costs of supplying and maintaining the electricity network. This includes transmission and powerlines that need to be built, maintained and operated as well as costs for billing and administration”
And from 2023
“From 1 July 2023, the daily service fee for small customers now also incorporates standard metering charges”
From the AER
“The fixed charge is not based on how much energy you use, but is the cost of supplying energy to your property. It is often called the ‘daily supply charge’”
So the reason they state is because they needed to charge for all the things that didn’t include generation, as a separate charge.
2 Likes
Thanks PhilT and grahroll…
It’s clear to me that the line items on our power bills are used by the retailers in order to make their prices more attractive… i.e. they can hike the unit price and lower the daily service fee or the opposite. Some charge two daily service fees when you have a controlled load, some don’t. Then you have the ones that charge you a fixed montly fee with no daily service fee. I’m pretty sure they play with these items in spreadhseets in order to create attractive plans as some people don’t look to closely… I spoke to one metering company at lengt and they told me they get paid about $0.50 per day per meter to cover their charges from your retailer. At least that is the case here in NSW… Thus the AER statement is not entirely correct as each retailer does whatever they want… I know they retailer are required to pay the transmission network providers, but it’s between them and the retailer… The retailer can use their unit price revenue, their fixed monthly fee revenue or a daily service charge to pay them. A regulated daily fixed service charge doesn’t exist…
4 Likes
It’s challenging to try and explain any bill or the price changes. Good to see the Flourish visualisation tool in use.
Some of the confusion comes from the many segments of the NEM. Some charges are regulated and some are not. Costs differ by region. Regulation differs by region. Terms/language used in discussing retail supply, wholesale and network costs are often the same or similar, hence context is also important.
EG Network Distributors supply tariff is not the same as the Retailer’s tariff.
Some costs are fixed, some are variable, and others a conversion (typically of variable to fixed).
EG retailers may offer a customer a flat-single rate supply tariff. The Network Distributor may likely be charging the retailer a cost reflective tariff (EG ToU) for supply to that customer. The Retailer will have estimated a tariff (charge per kWh) based on an average to continue to use a single rate for the customer.
Note -
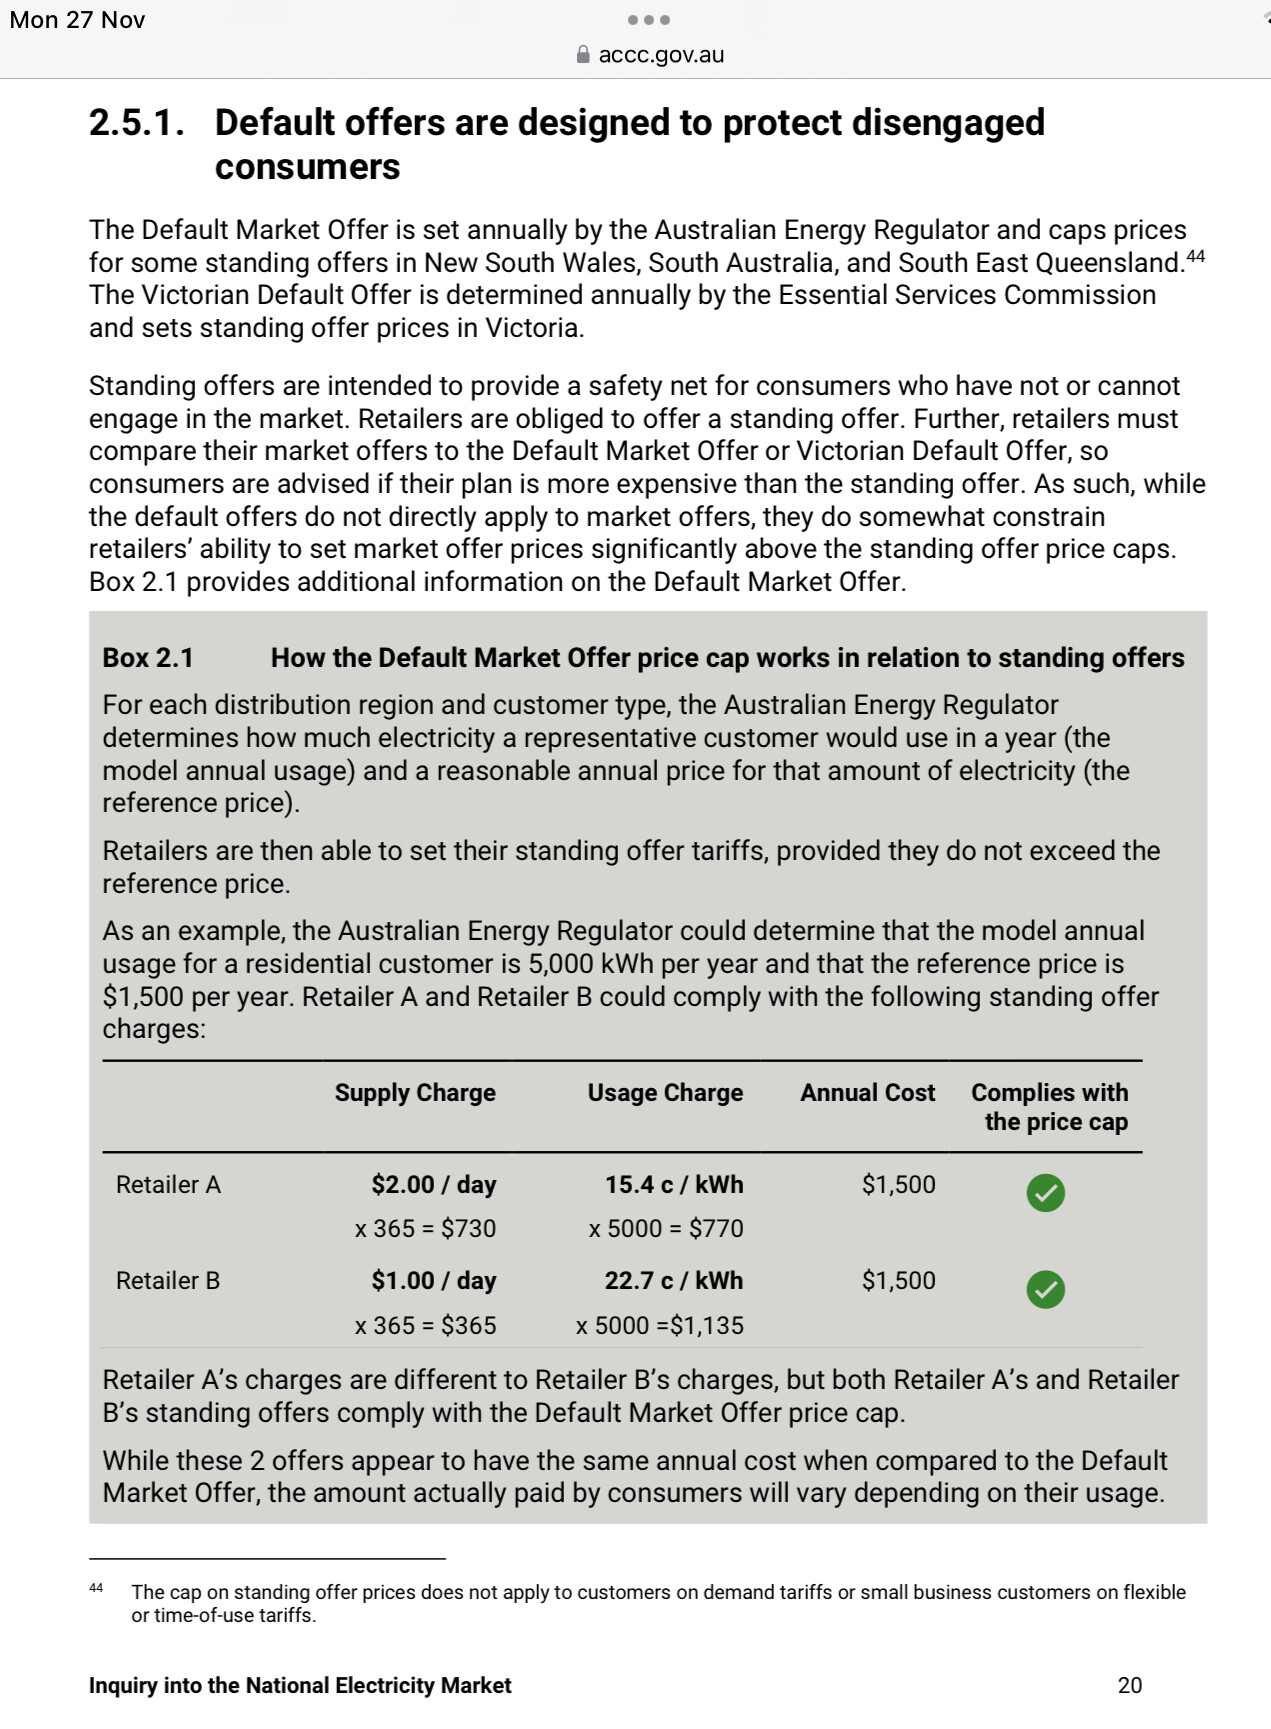
Retailers (region dependant) have latitude in how they structure their charges to recover their costs. Providing they comply with the DMO (Default Market Offer) price cap.
Note WA, NT, ACT, Vic, Tasmania are absent from the following. SE QLD is included with a qualification.
The network charges are split between the Daily Supply/Connection Charge (Fixed) the Distributor passes onto the Retailer,
and
The Usage Charge. It is often referred to as a tariff given the history of how electricity was once supplied. The Usage Charge (aka Retail tariff) should not be confused with the Distribution tariffs. The Retailer is free to mark up the Distributor’s costs to differentiate a plan or appeal to a customer segment.
3 Likes