I have long suspected many of the web sites I regularly visit are hosted on PCs having IDE HDD, 286 class cpus, 512MB of memory, and a 10 Mbps ethernet, or close enough. Ping
Or more to the point, if the server cannot serve, the rest is entertainment.
But your machine had so much less to do in many cases that it didn’t seem that slow. Sure there were jobs that were infeasible, like image processing, but in quite a few cases it really didn’t matter as the human was the slowest part of the system.
I guess it depends on how we define “actual” and “data”. It seems we’re about to be fed “actual” “data” that “debunks” the data that’s been so nasty to the NBN.
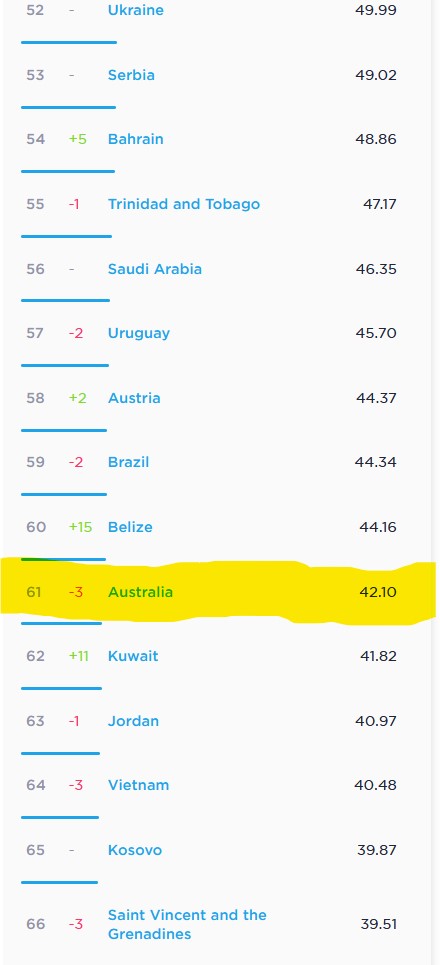
Look on the bright side - we have better Internet than Kuwait, Jordan and Vietnam.
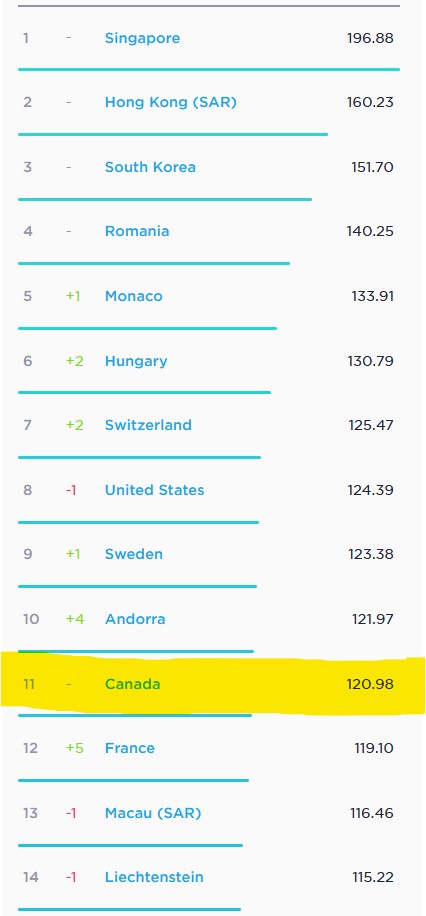
I must admit to being surprised the US is so high - I wonder what methodology is applied and whether it looks at mean, median or mode. It would certainly be interesting to see all three figures.
This source is the average of speed tests performed from those who chose to measure their mobile or broadband speed by country per month.
Until somebody can show me if and how the sample measured represents the population it is meaningless. This is rather like the ACCC whitebox statistics, it measures something we just know what.
An understandable view point. Consider that it also goes for most of what we pass as opinion within the community or from surveys of Choice members. The results are only ever a snapshot of those interested enough to respond. Even prepolling by political parties has been known to fail the reality test. Although it is also likely selective or targeted to minimise wasted effort.
In the interim, we can only relate what we have to hand. I’ll assume that any domestic bias in Aussie results from Speedtest is similar to bias in the results from most other nations. It is still a reasonable relative assessment or ranking, in the absence of any thing better. (Short of P Dutton et al legislating a data rate spying device on every connected customer on the planet, there will never be a statistically perfect measure. Perhaps Putin or Huawei also have a solution?)
If there is an analysis missing from the data it is a measure of how many NBN customers are not happy with the speed of their service because it does not meet their needs. Ignoring of course those customers who are not connected to the NBN, those who are connected but only use it for a phone service, and of course those the NBN discounts from it’s world when talking about the speed of service experienced by up to 80/90% of fixed line customers.
Those in satellite or fixed wireless service areas were only ever assured they would receive a service, one day, if they so chose? My interpretation of the outcome, when compared with the original promise!
One possible analysis is likely to conclude between 80% and 90% of NBN customers are happy with their speed of service. In an alternate formulation the assessment could propose less than 50% of all Australians are happy with the outcome delivered by the NBN. Who controls what is measured, how it is measured and officially reported should most likely be of greater concern, than the basis for the current internet speed rankings.
P.s.
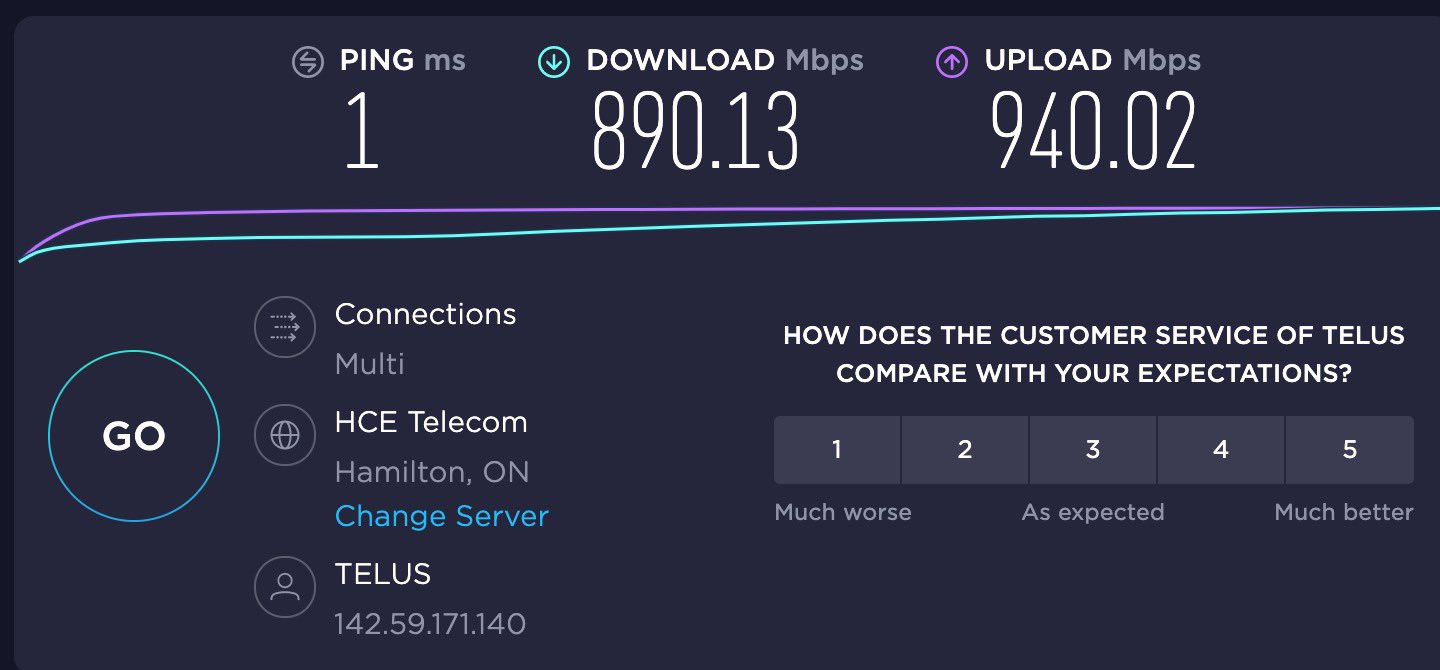
How do you know of your internet connection is suffering congestion? Perhaps if
I’ve just received my Sept Honesty Box results, and it appears they are no longer telling me how bad my internet speed is with the usual “Your internet is better than 14% of others on the same plan”.
There is a patchy (local govt areas?) coloured, albeit tiny, map of Australia in the email showing areas now covered by monitoring, although it is somewhat confusingly labelled “Avg. % Avg Down”.
It sounds like the decision has been made. You do not need to get worked up about something you don’t need to know about, as long as you pay your bill for whatever they provide.
Subtitled: Smile and be happy because it is what it is and is not going to improve anytime soon if ever (?)
I don’t think this was your monthly report. I think it was just an update on what they are doing & providing a link to the Sept CHOICE results. Interestingly they advise how many boxes they need for each product to include a result in the report which is something we had been asking about “we continuously monitor Retail Service Provider (RSP) broadband performance results covering all states and network technologies with a minimum of 50 Honesty Boxes”. They also advise they have “extended our regional coverage over the past few months”.
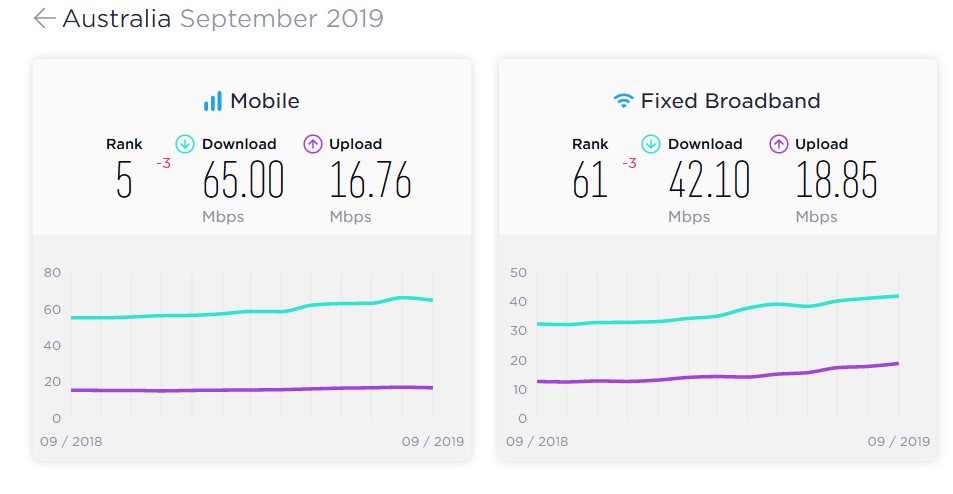
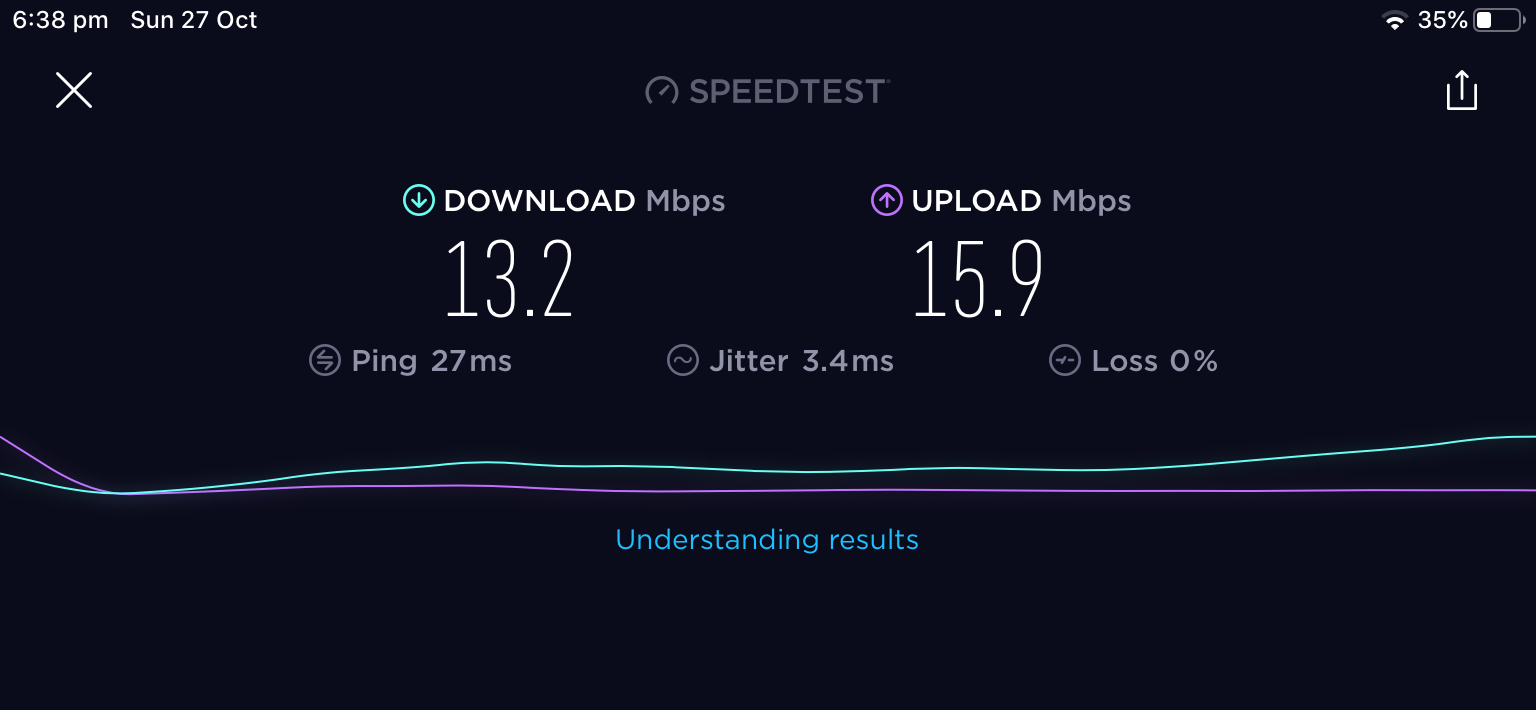
The picture is the monthly snapshot for Au.
Now to be able to view our results in real time is my next hope.
Looking at the number of tests done and the unique IPs for those tests for fixed Broadband (BB) I would happily assume the test is reasonably accurate as a picture of the mean. I take this from the 2017 report for Q2 to Q3 and would think these numbers would remain high for 2018 & 2019 but from the 2017 report for those Quarters Unique Users (I take this as unique IP addresses as not all have accounts) is 3,559,521, Tests done is 16,365,330 & Samples are 9,598,576. I think that makes the results statistically significant. As advised in my post ACCC Reports on NBN Performance - #171 by grahroll you could also contact Ookla™ to inquire about getting more information eg median, Std Deviation at this address Ookla Enterprise Inquiry | Ookla®
The Mobile BB figures are Unique Users 436,174, Tests 1,430,022, Samples 920,226. Again fairly statistically significant numbers.
Indeed there are many but what do they represent? They represent the speed available to people who were interested in testing their internet speed and knew how to do it. So you can say because of the sample size the average accurately represents that group, which is not the same as taking a measure of the service provided to the NBN population as a whole.
Those who want to measure their speed could be biassed towards those who are getting poor performance and want to measure it to get it fixed or those who are paying for faster plans and want to know if they are getting what they pay for, we have no idea. The size of the sample tells us nothing about whether it is biassed.
Not just nbn™, this measures all broadband connections eg ADSL & ADSL2+ would be included. The same criteria you placed on Australia would, I think, be the same for most if not all places in the World so our ranking would have to be fairly accurate. We certainly wouldn’t be 13th in the World as the Govt would hope to convince us of. If you want to know further details contact Ookla™, ask them and hopefully they will give you answers. Whether they will be quality answers is unclear as I have not asked them myself previously. What you might get from the Govt’s NBN Co is the number of premises connected to the various speed packages but these are also not good indicators of what speeds someone gets on their package eg a 25/5 Mpbs package might only get 10/2 Mbps, a 100/40 Mbps package buyer may only get 75/20 Mbps actual.
I don’t think many organisations or Govts would collect samples of that size that Ookla™ do, and over 5 million unique IP addresses of the currently assigned (but not necessarily used) 51,748,789 IP address for Australia (this includes both mobile and fixed from https://www.ip2location.com/databases/db1-ip-country). So the unique addresses size is close to 10% of the assigned addresses.
In all this however I don’t think anyone will ever get a totally accurate picture unless every premises, every user is made to supply the data. So you either have to accept some uncertainty or not use any metrics at all.
Optus, Telstra and many other RSPs use the Ookla Speedtest as their testing source.
Some more info from Ookla™ about how they work to improve the stat results:
Wandering OT with war stories but hoping to make a point about representative data.
As with many metrics, if one has a close enough approximation it can be sufficient to make the point, get the job done, the product made, or even get an orbiter on its the way to wherever. Too much consideration of precision can get in the way rather than add meaningful competence.
In the 70’s I did some work with a mathematician who had a NASA contract to solve 5th order differential equations on the computers of the day. The complete equation had something to do with a situation commonly found in space flight and took 5 pages just to write.
While osmosis can result in education the science and math was well beyond me and my role was implementing his directives. For some reason the particular case was a bugger and the solutions of the day took too long to be useful. His mandate was to develop a faster algorithm.
His solution was an approximation not a solution, and NASA went with it since the deviation from a full solution was small enough so the precision and controls of mechanical parts and rocket engines became the more important variables rather than having ‘just an approximation’ to drive them.
Likewise, the fastest computers of the day had no divide capability. They flipped bits and did a reciprocal multiply. The ALU rounded the last bit in CDC and Cray systems while all the others I am aware of just truncated. All well prior to IEEE standardisation.