We are now 75% of the way through our Solar PV install. The answer may be simple?
Payback Times are not reliable? They may be longer or shorter!
Sales reps will always tell you what they need you to hear? Have they guaranteed the payback time in the contract - no way!
Some of us can demonstrate great paybacks and returns. It might help where any of us do provide hard data if the actual feed in tariff and Retailer/State is appended as offers vary around the country.
Optional Content follows:
If you had a choice between
A) putting $5k under the bed for a rainy day
or
B) putting $5k into the bank for a few percent interest and paying tax on the earnings
or
C) spending $5k on Solar PV system and putting the savings on what the electricity bill would be each quarter under the bed (no tax payable - at present on the savings/income)
How much would you have in the bank or under the bed in five years time?
If the money from your solar PV is more than $5k you are ahead and have paid no tax on it which is even better. The past does not predict the future exactly, so it may take a little longer or a little less time.
No discounted cash flow, no need to forecast changing inputs and variables such as CPI, or guessing future electricity pricing etc etc You do need to wait five years for an answer though but it will be exact.
p.s.
If you must - play with fancy mathematics with integral and differential calculus to optimise the rate of return or assess risk options with a Monte Carlo Analysis - please, not here, or at least reduce it to simpler 1/S terms I can follow?
I did have some fun with the maths and decided the simplest approach was to take what the sales rep promised as a payback and half the earnings or double the payback period. This was a simple statistical review based on the fact that no two sales rep could provide the same answer to the same problem.
The discussion of traditional accounting practices to determine a NPV to compare the Stay in Business (do nothing) options vs the investment decision is perhaps then less relevant. Other than as a caution that the estimates of payback times are not reliable and probably longer than has been suggested.
It has become clear during the shopping and evaluation phase that there are a wide range of ‘quality options’ spanning roughly a 3X capital cost range.
One can purchase a 6.5kw PV array with a 5kw string inverter from anywhere from $3.5K to $9K, and a 5kw system with micro inverters for $9K to $12K Dropping off the suspect low end systems, from about $5K up all will deliver roughly similar solar power and should be expected to be reliable for at least 10 years.
The payback formula is based on original cost. A solid low end system will pay for itself years sooner than a top end system and both produce power and get the same FiTs and STC contributions toward the cost.
My conclusion, using autos as an example: There are choices like a Hyundai that gets you to your destination just like a Mercedes at lower capital cost. The value conscious will get payback for their systems more quickly so long as they have not bought junk (for this argument, products with under 10 year warranties on the panels, or under 5 year warranties on the inverters., or with cowboy type installations - eg 1.5mm wiring and inverters in the most convenient not the most appropriate places to minimise wire.
Conclusion: a $5K system will payback more quickly than the same specification but higher quality for $10K. How often does a Hyundai break compared to a Mercedes? It is an interesting decision process to weigh it up. If one decides to install solar one way to look at the payback time is to buy the most solid lower cost system to minimise payback time.
If a high end system produced say 10% more power over a year does that equalise payback time (FiTs and reducing power from the grid) when the initial outlay was almost double?
I decided to go solar and lean toward a solid low-mid range system between $5-6K with a solid company having a decade history behind it, with products that are well reviewed by consumers and installers (and Choice). T&C of warranties and so on are other considerations, but simplistically my equation that the $5K investment will pay for itself in about half the time as a $10K system is how I am considering the investment. The number of years are not as important as whether it is years or 2X years in the extremes. If a system goes for 10 years with everything under warranty it is probably long paid for and if it should disintegrate one hot afternoon the replacement will be the newest latest technology. Another thing to consider in the process.
Edit: At the last moment I decided not to take my own advice (I still have a bit of buyer remorse) and went for a high end system that will have a few years longer payback, but came bundled with a decade of monitoring and utility plan management support. Not the best value proposition but the company and installers have ticked every box so far.
Only time will tell if our choice of Solar PV equipment and installer meets our expectations.
On payback we made our own assessment. Of the four quotes we received the discussions of payback were either not committed to paper or overly optimistic and not representative of our usage. Suggested payback times were as low as 2 years! It is all part of the sell?
Our approach suggested payback of between 3yrs 8mths (@20c kWh feedin tariff) and 5yrs 4mths (@12c kWh feedin tariff).
This payback relies on stable tariffs over that time.
It does not include any assessment of the cost of the money invested in the system as an upfront cost.
Our system has 20 panels for 5.5kW peak output and a 5kW inverter.
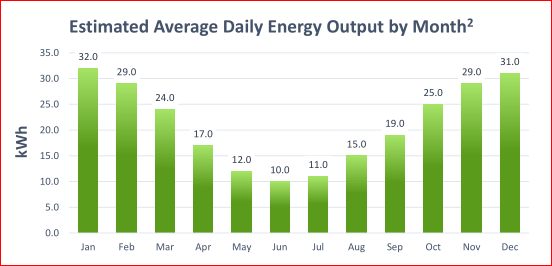
The installers quote provided an estimated annual energy output of 8540kWh. An online tool available on the LG solar web site gave 8147kWh as a result for a nominal 5kW system in coastal SE Qld. The LG tool provides monthly estimates of solar power with mid summer producing twice that in mid winter!
We used the installers quoted output derated to 80% as we understood the output was for a typical install. Our install is not standard due to steep roof pitch and the panels split for orientation over two roofs.
We also made our own estimate of self consumed energy. IE power not exported to the grid for credit. It was notably lower than the installers reps estimates. It is possible to determine more reliably if you can read your meter. Take one reading in the morning when there is first good strong sunshine on the roof (looks bright and shiny) where the panels will go and in the afternoon when the roof is no longer brightly lit. Over several days the difference will be a good guide to use. It is how we checked our estimate. It varies between 2kWh and 6kWh depending on if we ran the dish washer or washing machine.
We used 4kWh as our daily average self consumption. From the BOM web site we also obtained a number of sunny or part sunny days for our area (265 days per year) and assumed we would only be sure to have enough solar on those days.
Over the first few weeks of solar PV in Oct/Nov we have averaged daily 24kWh of energy output from the inverter (only one wet day). The LG solar calculator suggests we should have an average of 27kWh for each day for a 5kW system or inferred approx 30kWh for our 5.5kW panels in a typical install. Our decision to use a lower total energy production when determining payback appears to have been appropriate.
Solar proposals generally include estimated (best case) production. Here is an example from a proposal (Melbourne area).
For everyone who has one of these estimates handy and has tracked reality against the estimate, how have you been tracking over time once clouds and shading issues are introduced into the realities?
@PhilT, I’m going back to my installer to ask where mine is?
I think it is a great suggestion.
I invited 5 quotes for our install.
Three through solarquotes.com, of whom two responded.
And two from recognised installers on the Sunshine Coast, one being very prominent and the other very local or close to home.
All four provided panel layout plans using Near Maps and were fully aware of the roof tilt/pitch and other issues.
Only two provided estimates of annual system output!
Only one provided a monthly output bar chart similar to your example from Melbourne. Although I now understand the graph supplied was incorrect.
All used in discusion a multiplying factor to determine average daily output over a full year. The factors which were a minimum of 4.2 times the installed panel power to determine daily energy in kWh matched the table in the clean energy web site table for Brisbane.
It would be more than reasonable to expect a monthly production estimate for our design, with a caveate for shading. We do have shading which has at present a minor impact in the morning until 6:30am and in the afternoon from 4pm with a straight transition to full shade. These may be costing 2kWh per day now. The cost of dealing with the forest is much more than the return for the extra generation. The impact in winter will be much less.
I wonder if their estimates of output have an impact on STC or other rebates.
p.s. We considered a smaller system, but with the cost of extra panels relatively low, and knowing we would loose output in mid summer spent a little more up front to be sure. It also leaves/provides better for any peak summer daytime loading from aircon and future storage if battery systems ever come down to a reasonable price.
You can easily make your own graphs by using BOM Global Solar Radiation data, freely available on the BOM site. Use kWh/day units and multiply by days in the month X your panel rating will give an approximation for an unshaded site and panels facing north and a tilt of 20 or 30 degrees, for mid-southern Australia. Brand/type of panel temperature, shade, panel orientation, cloudiness vs time of day, and many other things will have an influence as well, so a fudge factor of 0.9 could be useful to get a more realistic number.
There are online calculators that take into account factors such as panel orientation and tilt etc.
Can’t think of the site names off hand, but should be easy enough to find.
I think the STC rebate is determined by what zone you are in- related to the above mentioned GSR.
Putting more panels in than the estimated minimum required often results in a shorter payback time.
Payback times seem to be very important for many, but I wonder what the payback time for their probably much more expensive car is?
… my bikes each cost three+ times what my solar cost - and together about what my solar cost to keep registered, serviced and on the road each year. Payback time is one twist of the throttle …
It’s easy to come up with a payback that suggests the client can buy a new Audi out of the savings,
It still does not change the fact that unless you are Uber driver the ROI or payback time for a car is determined by considering the cost divided by the income. IE 1/0 = a very large number of years.
I never got an estimate graph (long story) but the installer is well known to me and trusted and I’ve certainly not regretted going with him for the system …
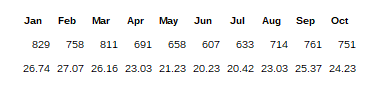
For my ~5kw system, production so far this year looks like (monthly total and average daily):
A quick summary is that my non-solar plan is flat with two steps with 92% of my consumption in the base step. The ‘excess step’ is only another $0.02 per kwh; the offered solar plan is time of day with prime being 7AM-11PM M-F. They will pay an $0.113 FiT but added $0.1215 (!) to my base rate for prime time while reducing non-prime by $0.0736. Calculus aside the Vic comparison site suggests I can save about $1,000! p.a. elsewhere even though my present plan is (after negotiation) as good as it gets without going to prepayments or other odd requirements.
The point is a $1,000 p.a. unnecessary contribution to an electricity provider will make a difference in how quickly a PV system can pay for itself. nb. I have been cautioned to not make waves until the meter is reconfigured, but as soon as it is I’ll be on the phone and probably moving on.
Hi there. Our first home (current home) has 5kW solar panels and played a big part in our decision to buy this home! We wanted to have panels for the environmental benefit anyway, but for this house they really are essential as the heating and cooling is ducted refrigeration - uses a crapload of energy and solar is needed to help offset the cost. The last 3 years the rebate from electricity company was very low, but recently switched electricity providers to one offering a better rebate on our electricity produced, and we are yet to pay anything (In fact building up significant credit for when the summer heat really hits). Definitely a bonus in the buyers eye in our opinion anyway.