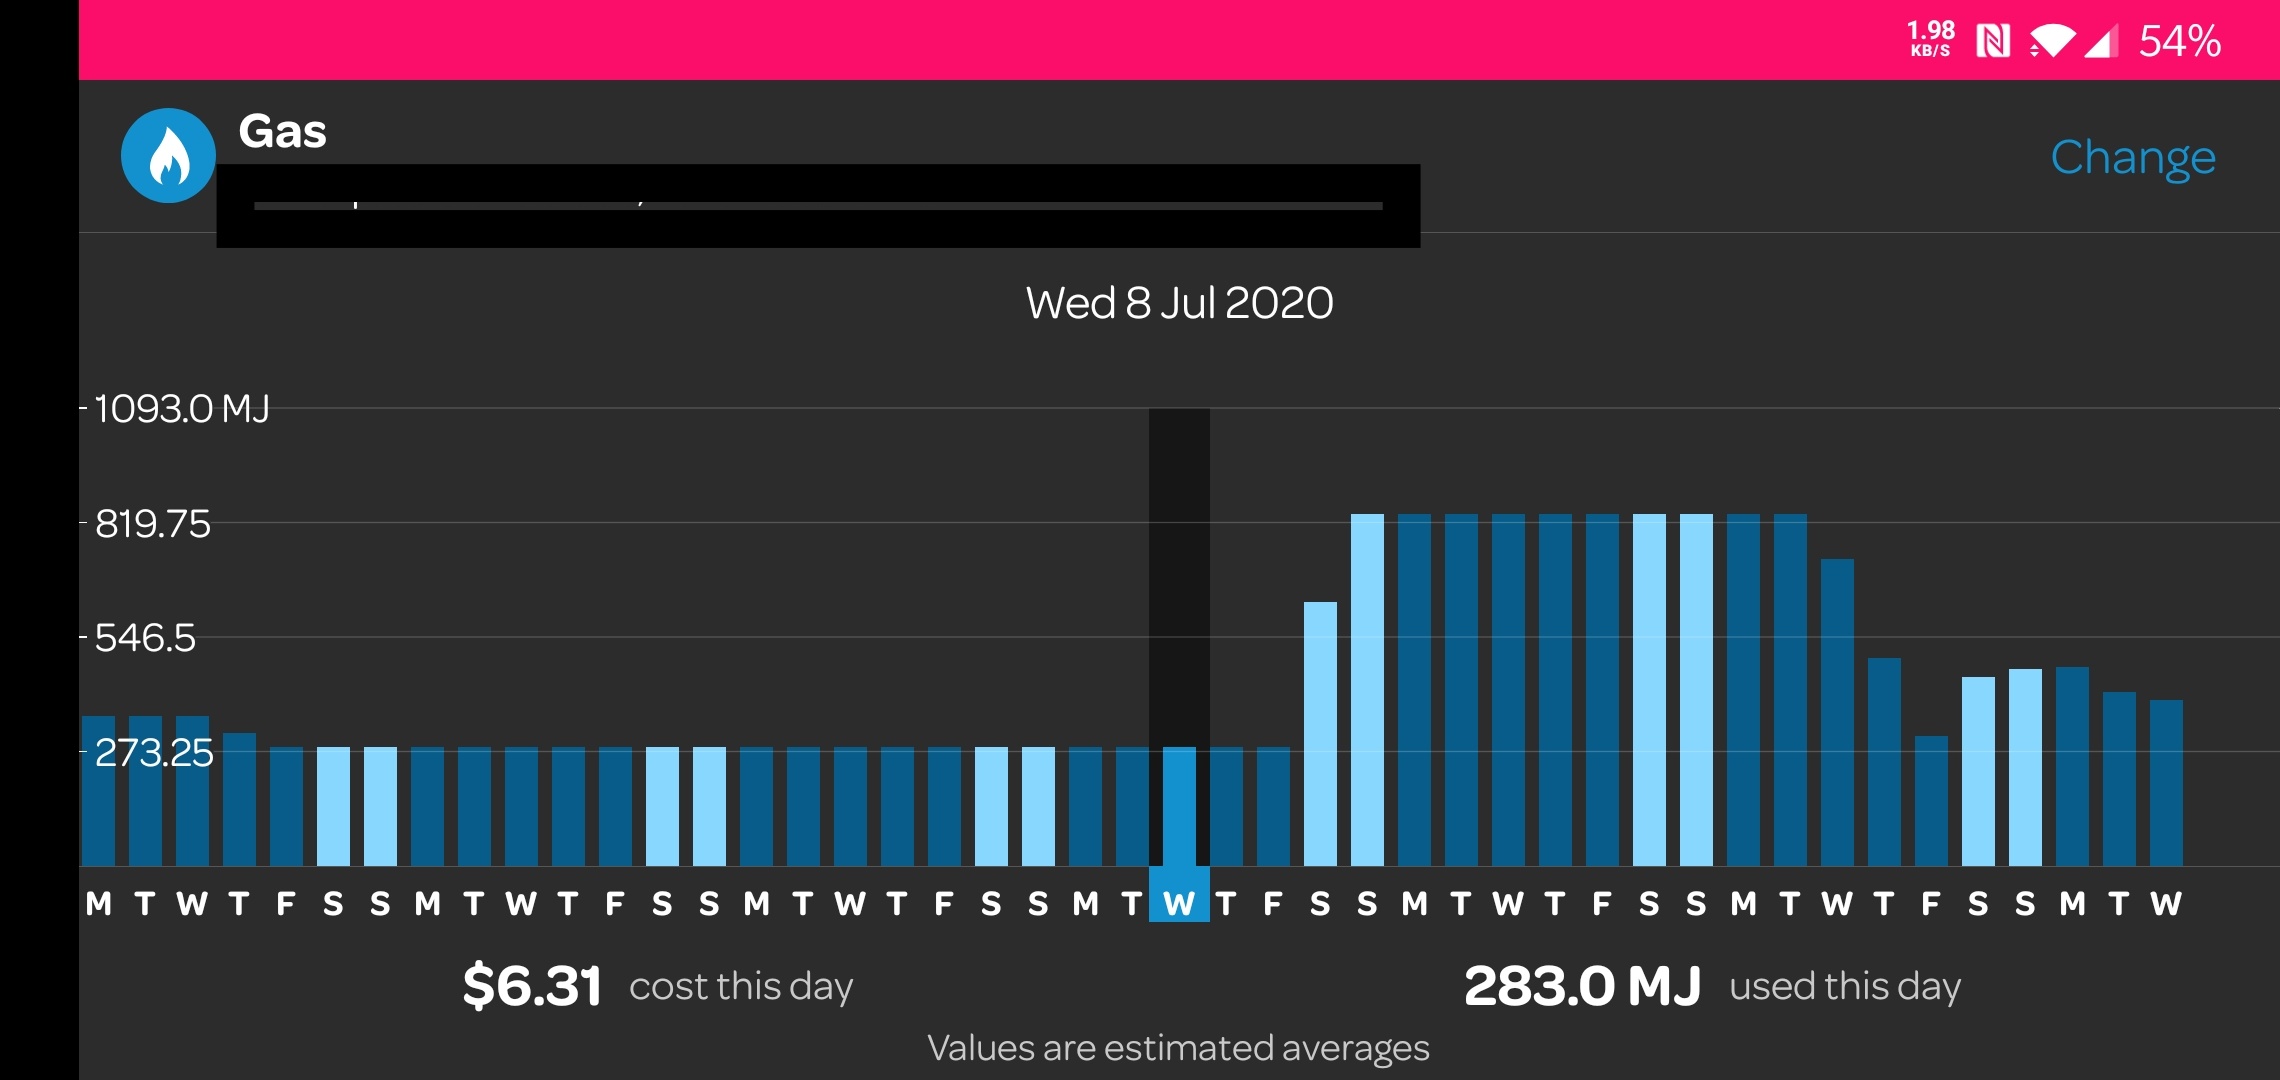
It goes up over a few days after the cleaning as the app is drawing the line it thinks equates to the increase in average usage. As I don’t have daily readings I have to explain how the daily average the app calculates has suddenly tripled after the cleaning.
I do notice this evening the heater and fan is almost constantly on.
The last time the graph changes corresponds with the previous self meter read around 18 June.
I am entertaining the possibility syncretic is raising. That the app’s projection was way off and that it has adjusted to a new reading by bumping up the average over a shorter period.
Is there anything preventing manually reading the meter each day at the same time? Say 8am or noon or 5pm, which ever is most convenient. From which you could produce a manual plot of daily usage, from the daily change in the meter reading. As a rough guide you could compare these with the average daily change in meter reading for a similar previous period. IE previous month if monthly or same month or quarter last year. A 3 times increase in daily usage would be abnormal where periods off similar usage are being compared. If the App is at fault here, it may help to show that it is misleading.
Note:
The meter value is not the MJ value used for billing. The supplier does a calculation based on an average energy value of the gas delivered if on a reticulated natural gas supply. It varies across each of our bills in Brisbane by a few percent.
Yep, I am now reading at the same time each day the last few days to get a better set of measurements. Although usage will vary depending on how much the heater runs.
I have a programmable thermostat that shows the number of hours the hydronic burner was physically fired up the previous day. Mine is an older model and this looks like the current one. They can often be bought in Australia via ebay at very reasonable prices.
Unless the servicing of the heater/ duct’s etc have left ducting etc disconnected or even damaged, I would be looking at the not so obvious. Hot water services (if tank style) have a pressure relief valve that some times leaks. Checking this might help.
It seems that the problem occured at the time of your heater service. Might just be a coincidence that another ‘gas item’ is causing the increased usage.
Had a similar problem on my ‘ex’s’ hot water service, but we kept looking at the heater (because of the timing of when it happened), was coincidence the hot water failed. It was the next door neighbor alerting us to the pressure relief valve because her dog was coming in with wet feet, even though it wasn’t raining…( he would visit their fence where our water was running under.)
Our hot water service was over 18 years old. A check of the pressure relief valve might help…Good luck…
I just remembered , this - be careful around gas fittings. They don’t always smell of gas ( slight breezes etc) Use a soapy water solution - Easy to make .
spray bottle
2 dessert spoons dish soap
water enough for sprayiing
2 teaspoon glycerin
I had a massive bill a couple years ago and found that a duct in the roof had come apart due to poor workmanship. This caused the heater to run longer to warm the house.
So thanks to everyone for their suggestions. I took readings from the gas meter every day at the same time. These I logged myself and also uploaded into Powershop’s mobile app. The mystery is solved.
The mobile app had been happily projecting my gas usage as much lower than it actually was. It averages the usage between readings and its projections were super low for mid-winter when I have also been working from home!
When it got a new reading (just after I had the ducts cleaned!), it adjusted upwards significantly making it look like there was a massive spike in usage over a few days, when in fact it was catching up with usage it hadn’t forecast from the month before.
By taking daily readings, it once again fell back again as it adjusted its forward projections. As I get closer to the end of the period it will become more and more accurate.
Its human nature to look for patterns and causation, and the simplest explanation seemed to be to find the cause of a usage spike - leak or damage. But this was just a coincidence and the real cause was my misreading of the data shown in the mobile app. I gave it too much credit for its reflection of real-world usage.
I hope this follow-up is useful to others in this CHOICE community.
Thanks for the update and pleased the mystery has been solved.
It will be very useful for other community members to check against information in this thread should they find a similar situation. It contains invaluable information possibly not available elsewhere.
The mobile app is very good, but I find that their website graph presentation is better. I keep an eye on the all time average and rolling average trendlines. I don’t think there is a way to display those in the mobile app.