Air quality issues plus Improving Testing of Air Pollution/Quality

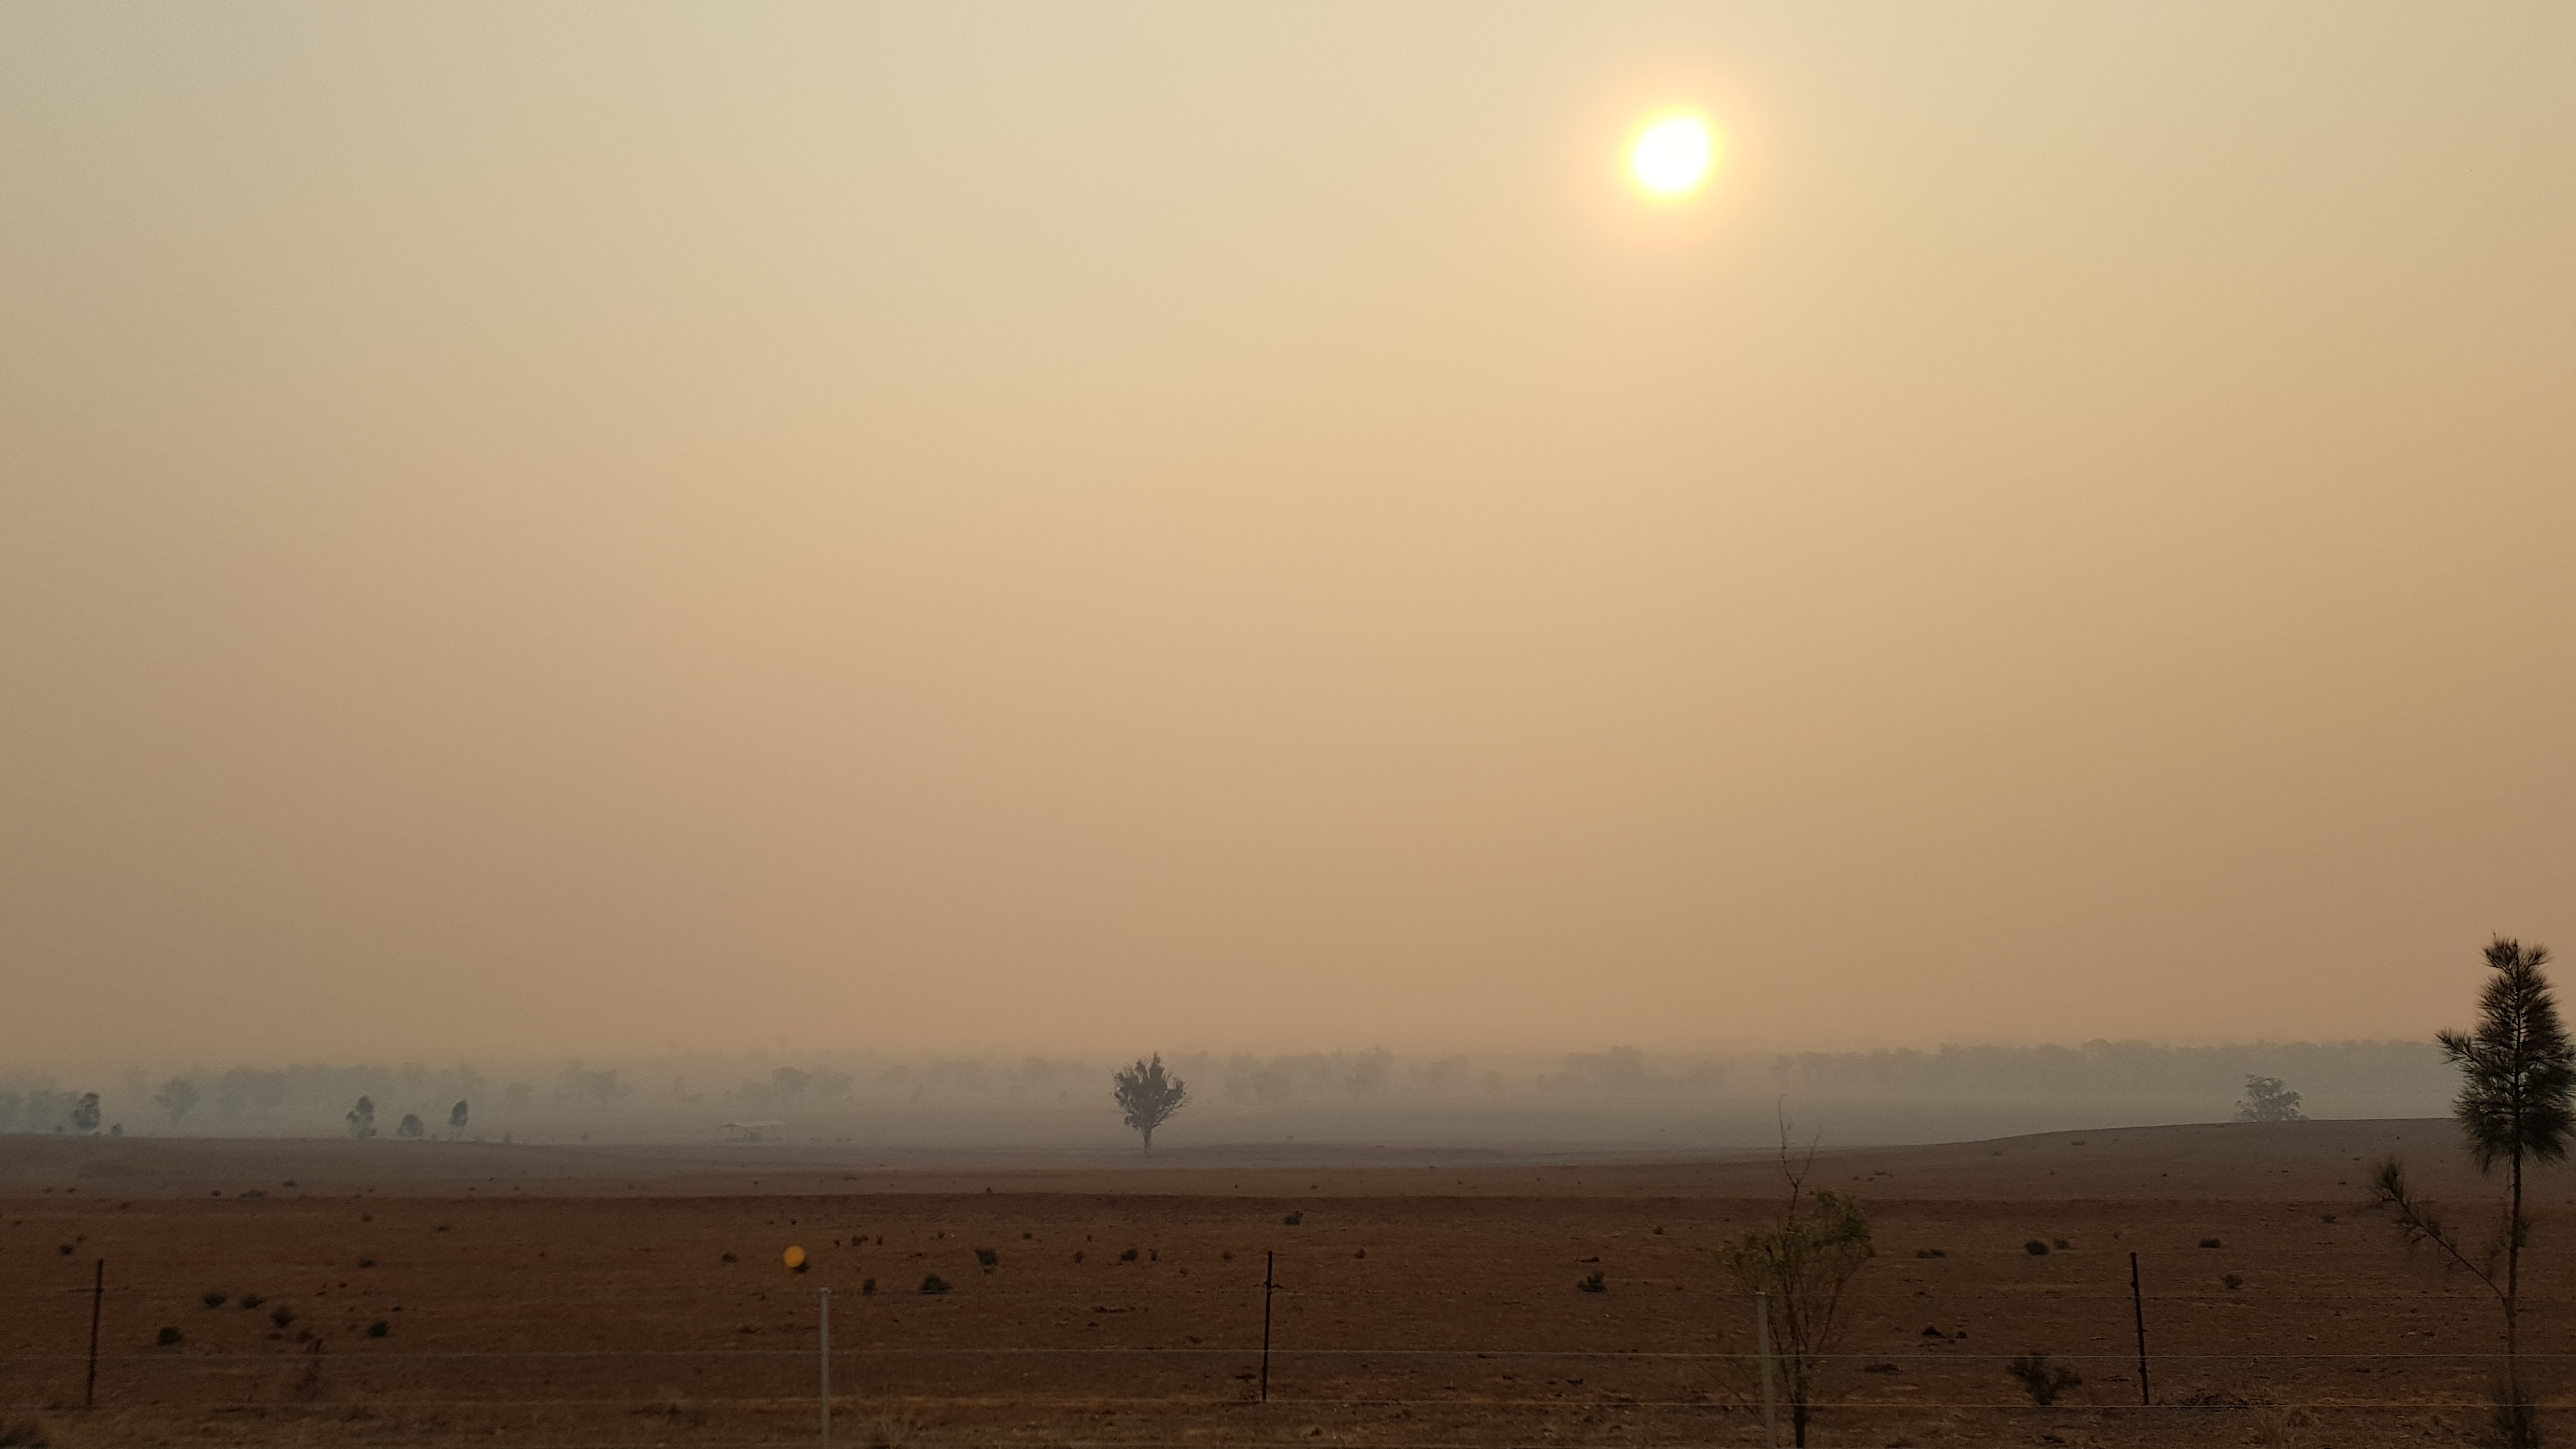
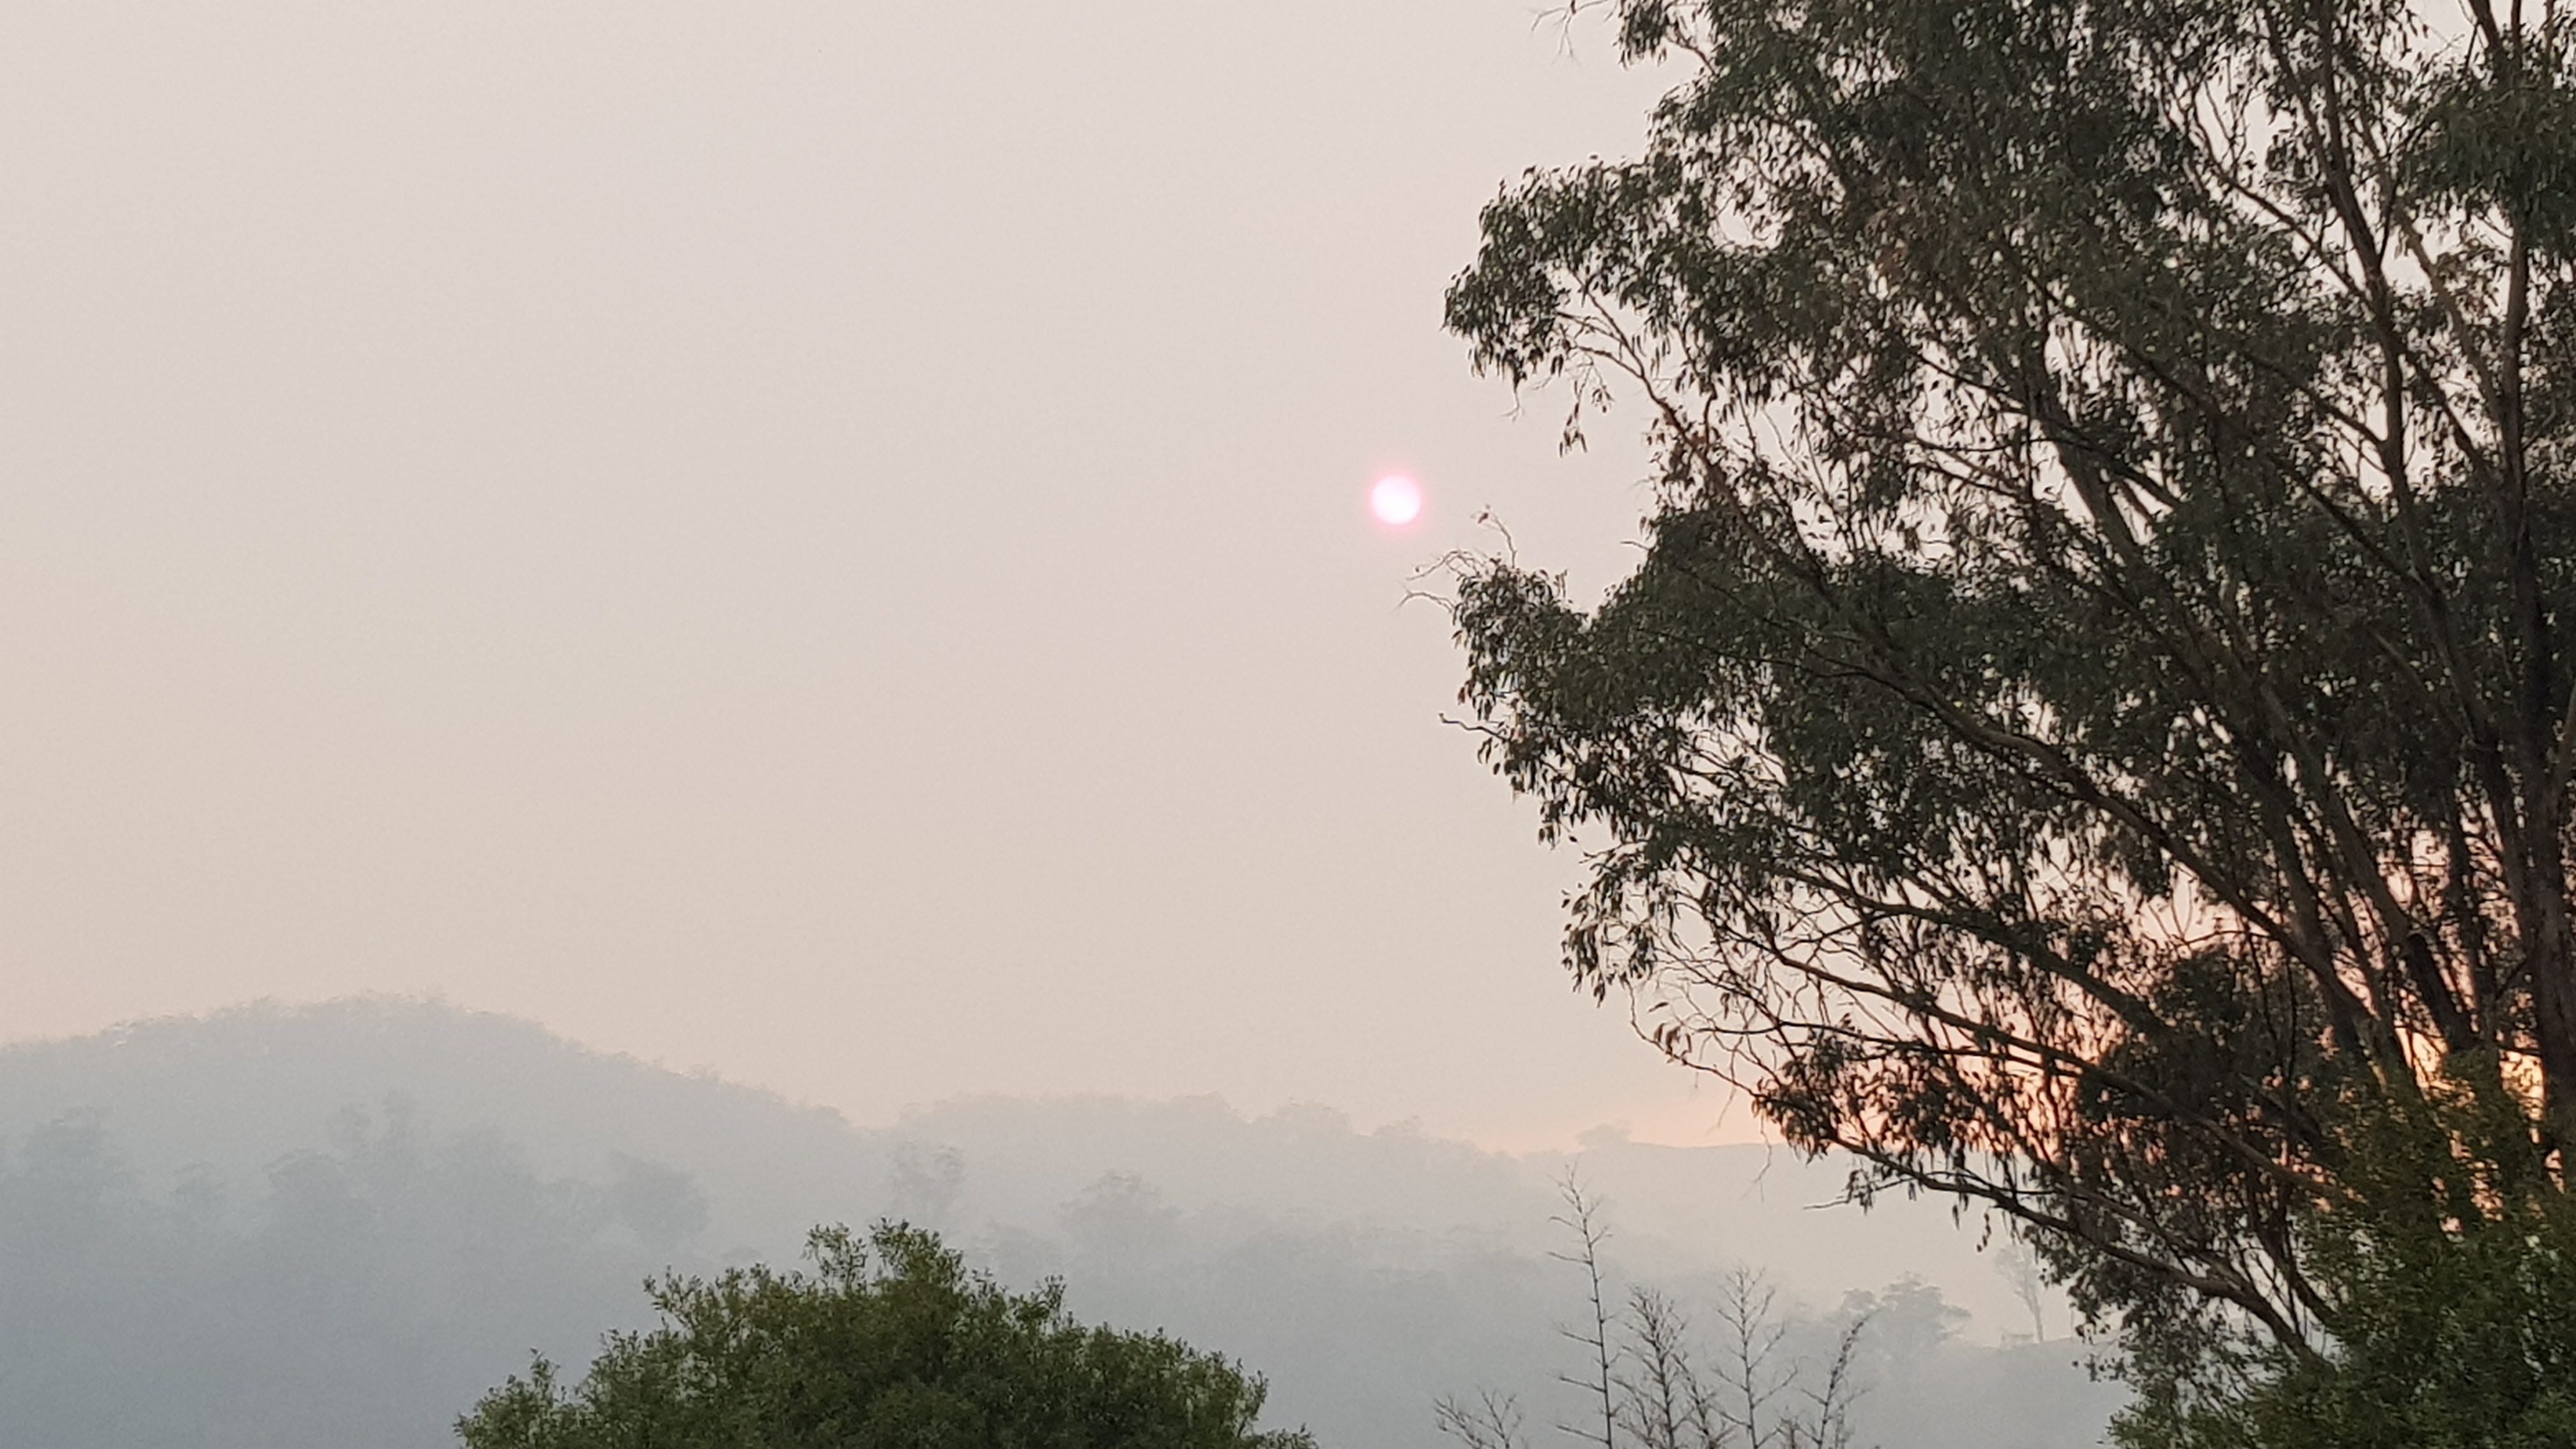
With the ongoing bushfire disaster in Australia starting well before the traditional bushfire season, poor air quality is likely to be an issue for many over the summer period, extending into autumn if no significant rain events occur.

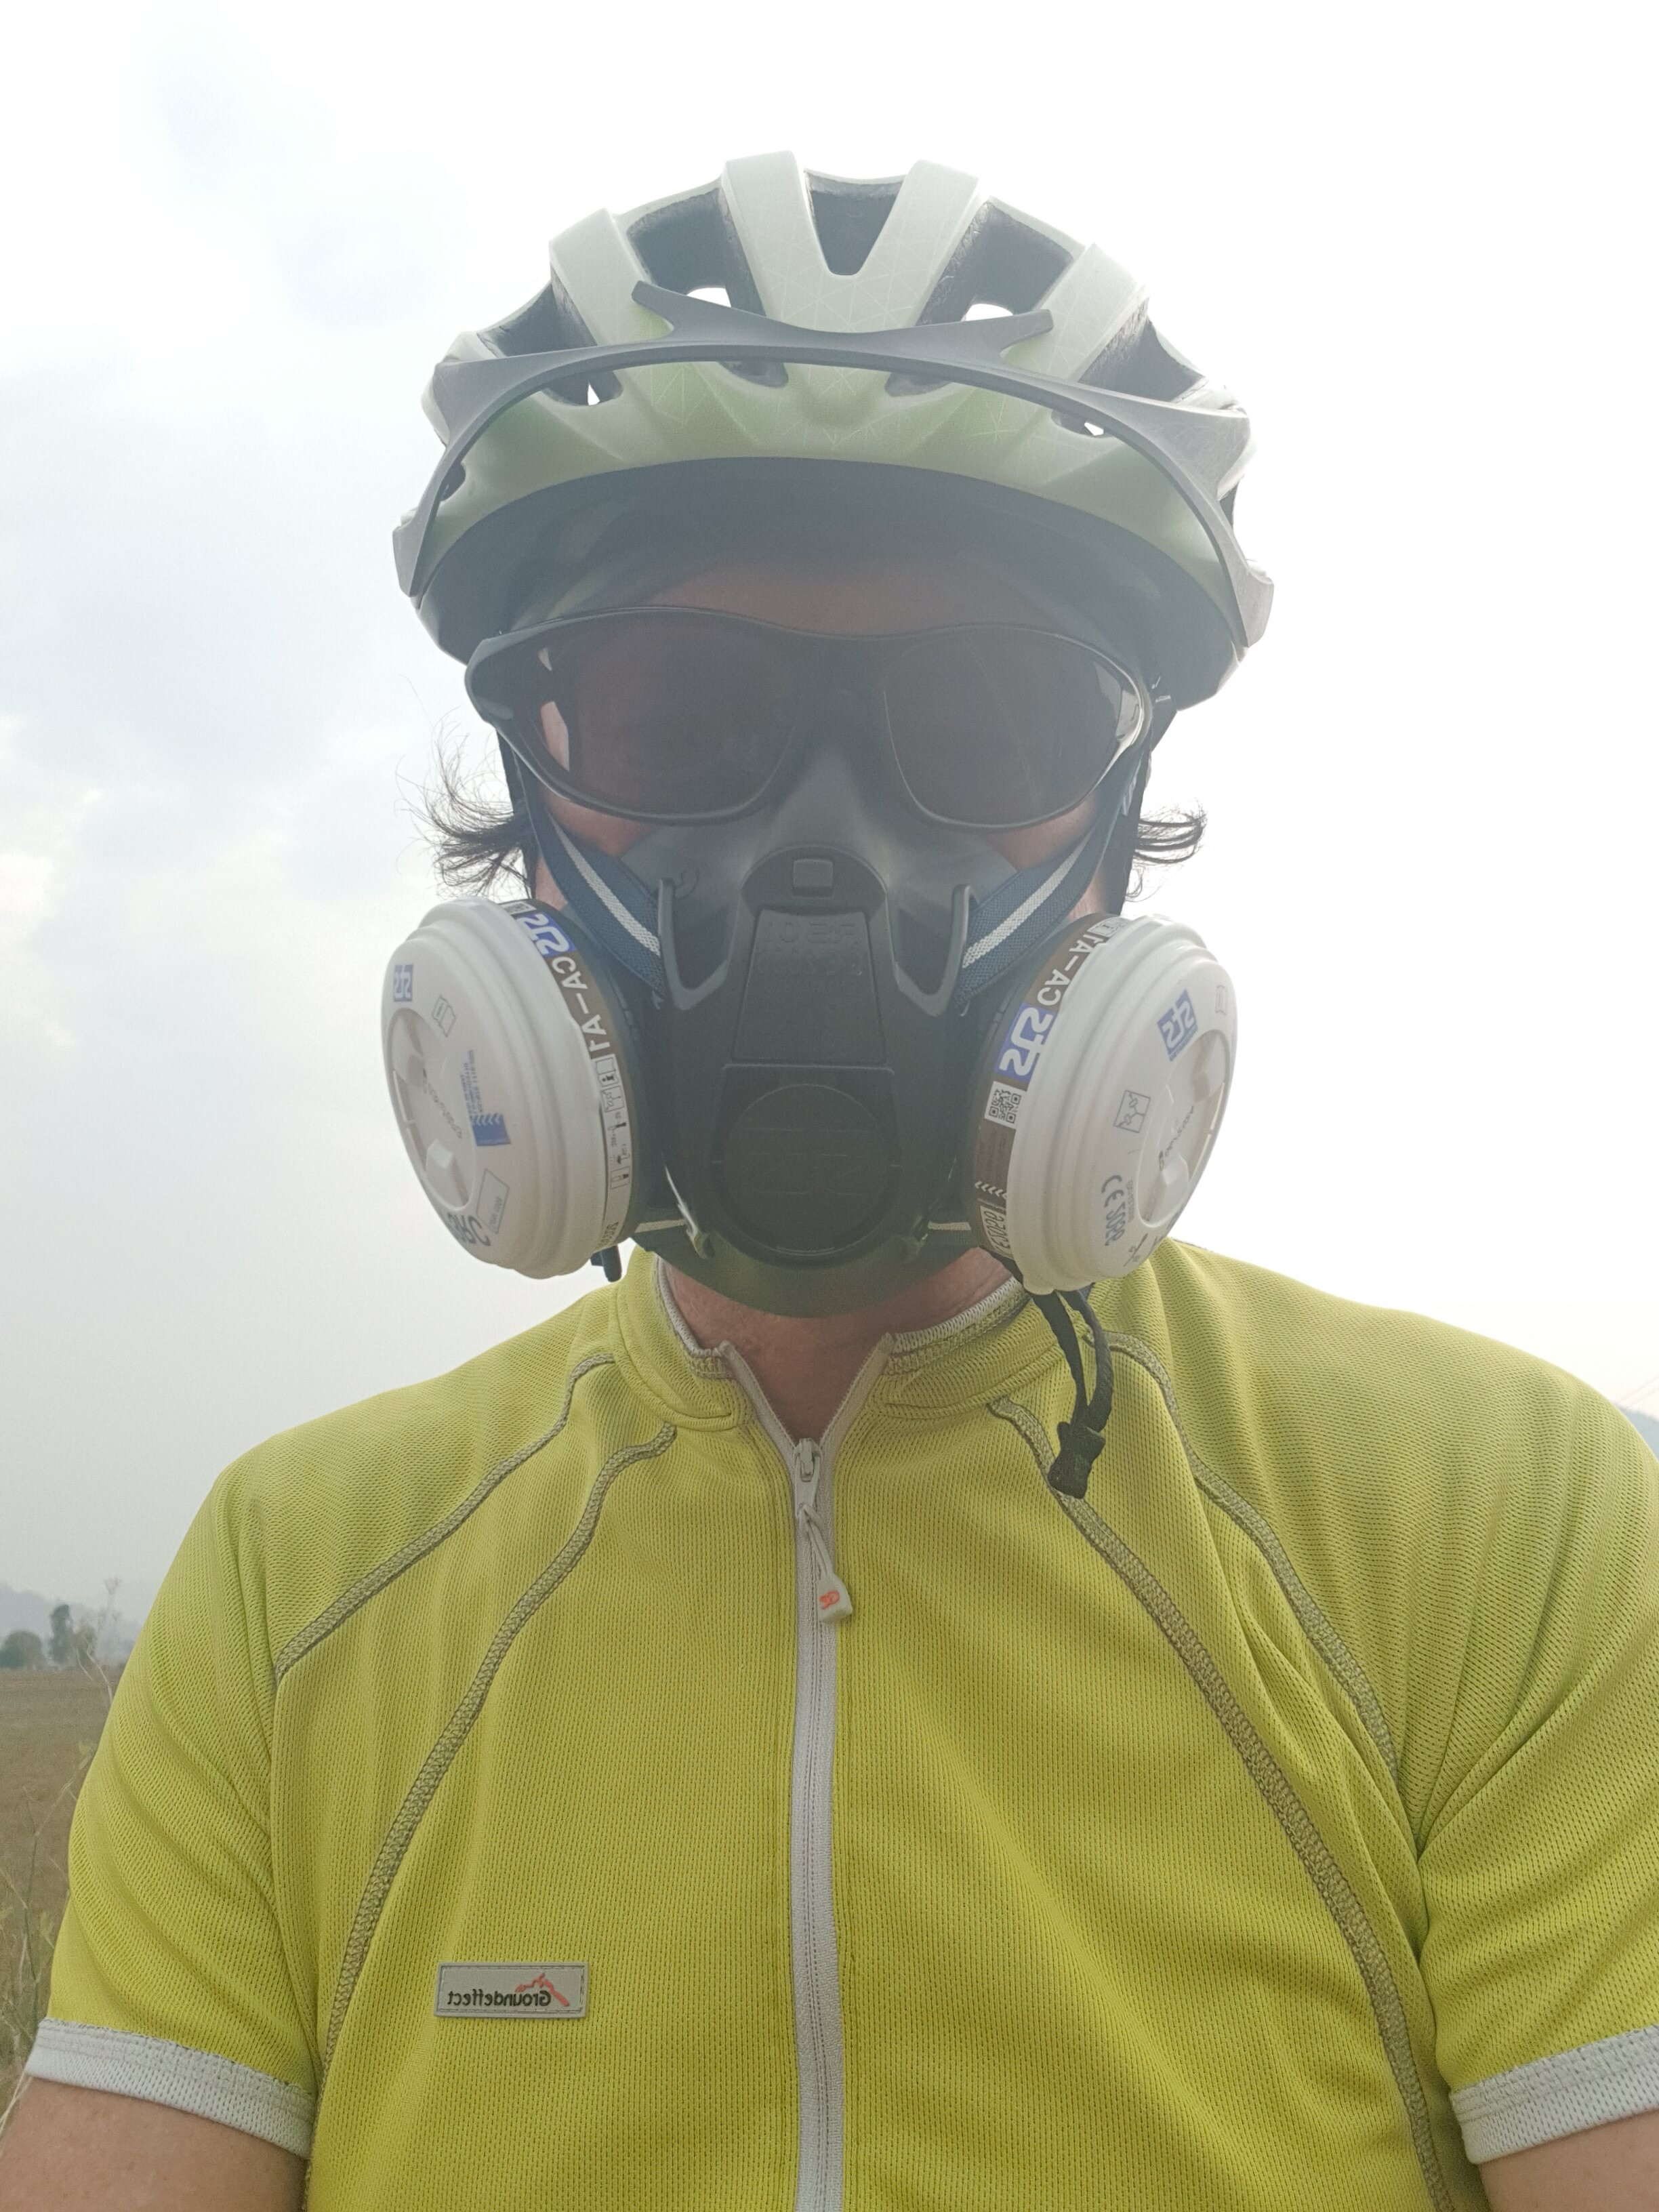
I’m in pretty good health generally, but extended periods of thick smoke, and occasional dust storms over recent months have been rather unpleasant, leading to sore throats, blocked noses and burning lungs quite frequently. That’s with avoiding my regular 2-5hour cycle rides 6-7 times per week, now I only go out when the air is reasonably clear (what used to be called hazy!), which is not very often.

I’ve been monitoring the NSW governments website here:
https://www.dpie.nsw.gov.au/air-quality/current-air-quality

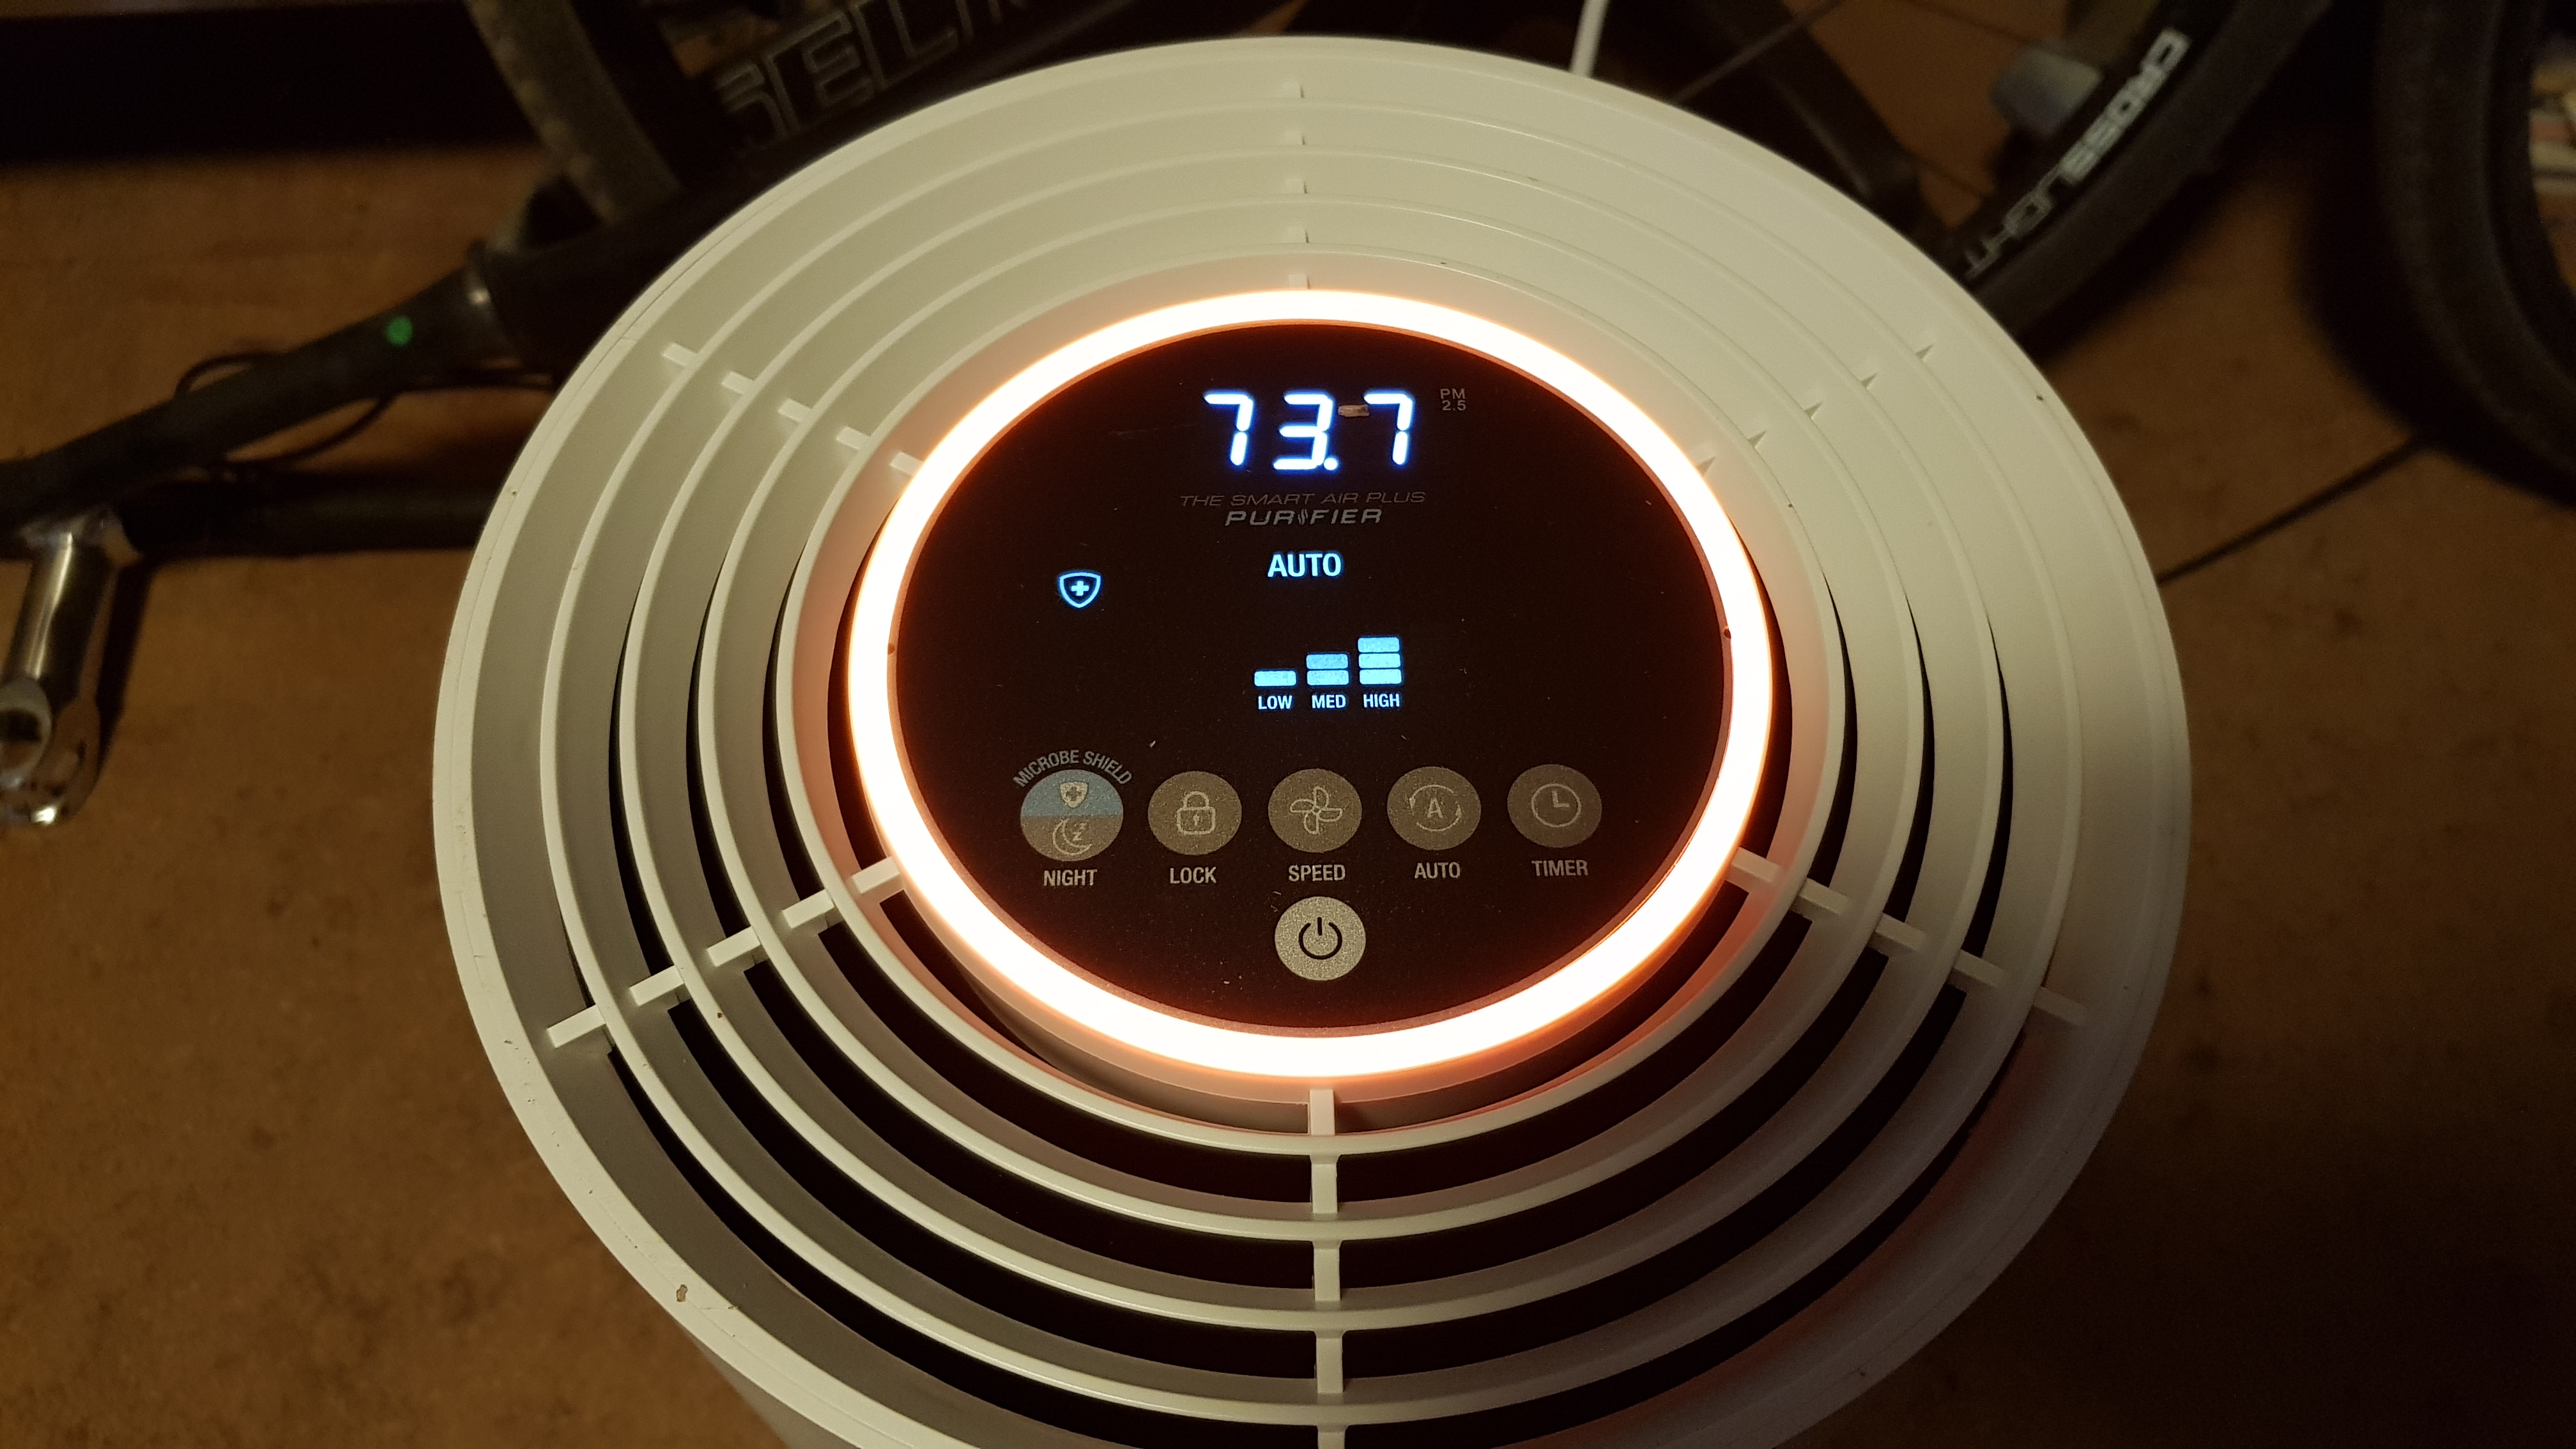
However, I have found that the 24 hour rolling average of PM10 and PM2.5 only has a very loose correlation with the actual conditions. I am located about 30km from the Tamworth monitoring site, so would expect some variation, but watching the high resolution Himawari 8 satellite images I can judge how similar my location is to Tamworth.

Basically the 24 hour rolling average presented by the government website is pretty useless as a guide to air quality. Right now Tamworth’s Air Quality Index is 457, but at this time yesterday the air was reasonably clear, so clearly it has been much worse than 457 for some of the time. I know it has been worse here than in Tamworth this morning, as I was in a thicker stream of smoke from a number of fires 20-40km ESE of here. The hazardous level for people with no health issues is 200.

Given the lack of usefulness of the existing available data, I phoned the EPA this morning and discussed it with a technician. He told me the Visibility NEPH (a nephelometer is the instrument used to measure it) is the best column to use for current conditions, since it has 1 hour averages listed.
That’s all very well if you live in Sydney, but Tamworth and many other rural locations do not have this data listed. He was going to talk to the science guys about it to see why, and said he would get back to me.

I don’t know anyone who is knowledgeable about the actual health issues, but I imagine there are acute and chronic symptoms associated with exposure to high levels of particulate pollution, particularly the smaller PM2.5 and under particles.
So, if an AQI of 200 is hazardous for all, and 66 is good, why is 20 minutes of exercise in AQI 200 air any worse than 1 hour in AQI 66 (= good, everyone can enjoy all outdoor activities). Surely they both represent the same quantity of particles inhaled?

5 Likes

The corresponding one in Queensland is:

For those in the Brisbane area, Brisbane City Council also have their own live air quality website:

On the weekend I was reading that severe busfires leading to long term poor air quality are cyclical events in Australia. There are records that during the Federation Drought (one of the world’s worst megadroughts and currently Australia’s worst drought), there were accompanying severe bushfires. Historian Don Garden review of newspaper articles from this period indicated that “much of Gippsland (eastern Victoria) was devastated, with smoke so thick that daylight turned to dark, and offshore coastal shipping was forced to slow, smoke from the Victorian fires even created a haze over Sydney.”

Jill Kerr Conway also noted similar scale events during the severe world war II drought where much of eastern Australia was ravaged by the drought and bushfires. She also noted that Sydney also experienced massive dust storms which resulted in thick dust covering/depositing over everything in the city.

History indicates that this will not be the last drought and bushfire event, and maybe if the frequency of such events increase as a result of climate change, one may get future use from air purifiers if and when there is a reoccurrence.

4 Likes

It may not be that exact a science?

The assessed hazard levels assume a standard respiratory rate and volume averaged over a longer term exposure period.

It is about more than how much air any of us transpire in a single hour or 20 minute period.

Exposure levels based on Time Weighted Averages (TWA) typically reflect different time periods for exposure. EG safe exposure level 30mins, one hour, 8 hours, etc.

Somewhere in the standards will be the relevant details relating to the quoted AQI. The risks for most of us are cumulative over very long periods of time, EG hundreds or thousands of hours. Those of us with serious respiratory related conditions excepted.

I’d be cautious of a simplistic device that measures the density of dust in the air as being more than an approximation. A standard nephelometer measures density but does not assess particle size. Even the type or nature of the airborn dust particles will affect the readings. It provides an indicative as opposed to absolute measurement. It is however a quick and convenient tool.

Accurately measuring airborn dust requires multiple layers of progressively fine filtration, to separate the different sized particle streams. Some places use more advanced and expensive systems to provide continual monitoring and indicative measurements based on the standard dust sizing. EG PM10, PM2.5

4 Likes

They do have PM10 and PM 2.5 values listed as well, just that their usefulness is greatly reduced by averaging over 24 hours, rather than real time/1 hour averages, hence the fall-back to using the NEPH values, which are listed as 1 hour averages.
There is a network of non-government monitoring stations, albeit with very sparse coverage, of Purpleair monitors that do give real time values, see here: https://www.purpleair.com/map?opt=1/mPM25/a10/cC0#5.27/-31.695/149.344
A friend of mine operates the one at Coonabarabran.

6 Likes

I’m guessing the general safe exposure levels for PM2.5 and PM10 are based on a 24hour TWA?

For simplicity this avoids or evades a more complex discussion of safe exposure limits for shorter time periods. It certainly avoids having to politically react to short term spikes in readings that may be many times greater than the acceptable long term exposure level.

I understand the concern in not really knowing the hazard exposure, IE what is in the air, when you choose to go for some more intense outdoor activities.

It’s useful to know there are some alternative sources of data.

6 Likes

Perhaps, but if that is the case, then the advice to avoid any outdoor exercise, even for 5 minutes, is rather inconsistent! Whilst I have competed in 24 hour mountain bike races in the past, not many people engage in exercise for that period of time.

3 Likes

The WHO has guidelines which will be of interest. They give the rationale to PM2.5 and PM10 exposure limits. These limits are measured as average hour and 24 hour means respectively.

Like noise, particulates is all about the dose. The higher the dose, the higher the risk of health consequences of the exposure. Shorter times means one can be exposed to a higher concentration of particulates (like noise) before damage is caused. Long term exposure the limits are less as there is a compounding effect of time.

4 Likes

Interesting reading.
I’m pretty sure I’ve been exposed to more than a safe level of PM2.5 for a year in just the past few weeks!

Now if only we had some comparative reviews of PM2.5 face masks and air purifiers…

3 Likes

I’m not sure it could really be called a benefit, but today’s miasma is so thick here that my measured UV radiation level is a very safe 1.6, whereas with no smoke it would be up to 16 at this time of day in summer.
I woke up with stinging eyes and sore throat, and could barely make out the sun an hour after sunrise- just a dim red disk.
It is so unpleasant that I’ve just ordered myself a Breville air purifier. I had to do a lot of searching, many brands and models appear to be out of stock, which is not surprising. Another stand out was the varying claims for coverage area for particular models, both between stores, and even on a single page at some stores.
On the way into town yesterday afternoon

This morning

2 Likes

Takes the ”great” out of the “great Australian outdoors”.

“How Great is the Australian Indoors”?
Or
“How Great is Hawaii”! :wink:

Hope the Breville helps.

4 Likes

Me too!
Like a few of the other brands I looked at, it has its own PM2.5 display, along with a colour coded ring of light (possibly somewhat larger than necessary!) to indicate air quality.

Photo shortly after turning it on, although I did briefly see readings around 100, which falls into the poor category. Orange, (67-99) in this pic is fair

I’ll see how it goes after a few hours.

4 Likes

Well, it seems to do the trick, in an open area about 15m X 4m, with adjoining rooms and open doors, plus 2 other fans running at high speed to mix and circulate the air, the AQI has been below 20 for quite a while.
There is a faint slightly dusty smell, but with my nose being almost permanently blocked up with smoke and dust, it’s a bit hard to tell!

5 Likes

Glad to hear the Breville air filter is working @gordon . Hope you all feel better.

I agree. The forecasts are that this summer is going to continue to be a stinker, and the bushfires are likely to continue at an unprecedented rate, so these are going to be needed.

The ABC had an interview with Lidia Morawska (Professor, QUT Science and Engineering Faculty, Chemistry, Physics, Mechanical Engineering, Environmental Technologies) where she talked about air filter masks. She said that the non-disposable surgical type masks are useless, and you need at least a Class P2 half face mask fitted so that it has no air leaks around the edges. If there are air leaks, then they aren’t effective.

As a start, perhaps Choice could do a quick check and see if Class P2 face masks work as claimed, and possibly a comparison?

2 Likes

Thanks @meltam.
This morning the air quality outside was quite a bit worse than it has been, and since my house isn’t quite finished, a few missing cornices, unsealed roof access etc, quite a bit was leaking indoors. Last night wasn’t too bad, but the smoke increased through the night and up to late morning, even with the purifier running in ‘turbo’ mode, PM2.5 AQI (ug/m^3) was up to 170 inside. I hate to think what it was outside, but I could only see the hazy outline of trees out to about 500metres, and clearly on ground level to about 150m.

The purifier has now brought the PM2.5 down to 32, a huge improvement! I’m not sure how long the filter will last if this keeps up, but it does tell you when it needs replacing.

I had to go into town yesterday to collect some freight (no one wants to deliver 35km out of town), and called into my favourite equipment supplier and asked what they had in PM2.5 protection masks. Out came various models of paper disposable masks, which I pointed out were useless in thick smoke, before getting to the professional quality masks. I settled on a Maxipak TPE Respirator Painters Kit, which has dual gas filters, and P3 filters which clip on over the top.

I took a wander around outside and it appears to work quite well, at least with general non-intensive activity breathing rates, not being too restrictive when walking up and down the moderately steep ground here. I wore it for about an hour inside after that until the indoor PM2.5 dropped below 80, and found that it wasn’t too uncomfortable, but it was nice to take it off :wink:
9:50 this morning:

4 Likes

This errr… guy I know by the name of Darth Smokerider tested out the mask mentioned in my previous post, and he reports that it is ok for use when cycling with heart rates up to 155 (reasonably strong effort, but well short of flat out).
It does get a bit humid inside the mask in warm to hot temperatures, necessitating an occasional stop to wipe away nose drips and sweat, but isn’t too restrictive to breathing at that sort of effort.

4 Likes

I’m please to see that the Asthma Council is also calling for more useful data now, this report from The Guardian’s live fire reporting page:

The Asthma Council wants the government to change - and standardise the way we measure air quality, and invest in real-time reporting, given the hazardous air conditions across the country:

What’s deeply concerning is that all Australian states and territories, have different approaches to sharing air quality information. There is no national requirement for real-time air quality reporting of the harmful PM2.5 fine particle pollutants found in bushfire smoke. Bushfire smoke fluctuates rapidly. Information and advice based on average concentrations of PM2.5 over a 24 hour period is not helpful. Side effects can be experienced as soon as pollution levels begin to increase – they do not wait 24 hours.

…There is no safe level of PM2.5. It is critical reporting data provides useful information to guide the serious decisions people and organisations need to make to protect public health.

While especially dangerous, even life-threatening, to people with asthma and respiratory problems, PM2.5 impacts even people who previously did not have such health problems.

2 Likes

In Sydney today the air pollution is terrible. I have suffered from respiratory problems in highly polluted cities overseas and I wanted to find out how the air pollution in Sydney compared, particularly for PM2.5 particles which are known to be a serious health hazard. Surprise, surprise - the NSW Office of Environment and Heritage only reports the PM2.5 level as a 24 hour average, not hourly as it us reported in other countries I have checked. The website World Air Quality Index (aciqn.org) which reports on air quality worldwide says this “can make it really difficult to find out what the actual air quality is in real time…For instance, the PM2.5 24 hour average can be Good in Sydney, but the Visibility could be well past Hazardous. In this case, it would take several hours for the PM2.5 24 hour average to report as hazardous because there could have been a fairly good air quality over the last 24 hours and only just recently has the wind started to blow the smoke towards Sydney”.

There are hourly reports of Visibility but this is an inadequate indicator of hazard level. The OEH description made me laugh as it was so simplistic: “Visibility (Vis or NEPH) is a good indicator for smoke. If the Visibility AQI is “Poor” or worse, then there is likely to be significant smoke outside. If Visibility is “Fair” (yellow), there could be some impact due to smoke. While visibility is also affected by dust, the instrument is more sensitive to smoke” .

I am not clear why other countries such as India can report on PM2.5 hourly in cities but NSW authorities do not provide the same information? (I haven’t checked other states). Is is just that our authorities have become blasé about our air quality? This data would be collected, why isn’t it reported? This is especially of concern on days when the air pollution levels are high. It would enable people (especially those susceptible to respiratory illness) to make evidence-based decisions about the best time of day to go outside.

A bit more about PM2.5 hazards here (following the info on masks) for those who are interested:aqicn. mask org/mask/

5 Likes

In the Hunter the people suffering as you have and have to put up with PM pollution from coal mines all year round. They have continuous reporting and a special web site that displays it. They are advised to stay indoors when it gets over the limit. Of course for many this is impossible. You might think that the mines would be compelled to reduce pollution or shut down if they cannot to keep the PM under the limits.

That doesn’t happen. The reason is the same that our fearless leaders say nothing about extraordinary bushfires and allow our real greenhouse gas emissions continue to grow while hiding behind fictitious reduction targets: coal is king.

5 Likes

I’ve noticed this too. I have no idea why they report 24h rolling averages. So confusing and misleading :frowning:

3 Likes

I agree with you fizwidget, we need 24hr rolling averages for our personal health and safety.

Great recommendation, thank you for sharing!

1 Like